
Page 132 - IJPS-11-5
P. 132
International Journal of
Population Studies Regional disparities and fertility rates
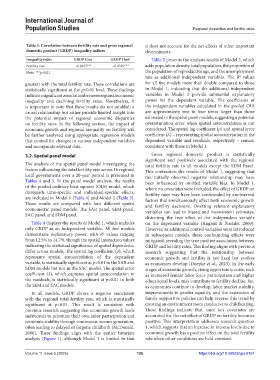
Table 3. Correlation between fertility rate and gross regional it does not account for the net effects of other important
domestic product (GRDP) inequality indices determinants.
Inequality index GRDP Gini GRDP Theil Table 5 presents the analysis results of Model 2, which
Fertility rate −0.8455*** −0.8329*** adds population density, total population, the proportion of
Note: ***p<0.01. the population of reproductive age, and the unemployment
rate as additional independent variables. The R values
2
greater) with the total fertility rate. These correlations are for all five models more than double compared to those
statistically significant at the p<0.01 level. These findings in Model 1, indicating that the additional independent
indicate a significant association between regional economic variables in Model 2 provide substantial explanatory
inequality and declining fertility rates. Nonetheless, it power for the dependent variable. The coefficients of
is important to note that these results do not establish a the independent variables calculated in the pooled OLS
causal relationship but rather provide limited insight into are approximately two to four times larger than those
the potential impact of regional economic disparities estimated in the spatial panel models, suggesting a potential
on fertility rates. In the following section, the impact of overestimation error when spatial autocorrelation is not
economic growth and regional inequality on fertility will considered. The spatial lag coefficient (ρ) and spatial error
be further analyzed using appropriate regression models coefficient (λ) – representing spatial autocorrelation in the
that control for changes in various independent variables dependent variable and residuals, respectively – remain
and incorporate relevant data. consistent with those in Model 1.
3.2. Spatial panel model Gross regional domestic product is statistically
significant and positively associated with the regional
The analysis of the spatial panel model investigating the total fertility rate in all models except the SDM Panel.
factors influencing the total fertility rate across 16 regional This contradicts the results of Model 1, suggesting that
local governments over a 20-year period is presented in the initially observed negative relationship may have
Tables 4 and 5. In the panel model analysis, the results been influenced by omitted variable bias. In Model 1,
of the pooled ordinary least squares (OLS) model, which where no covariates were included, the effect of GRDP on
disregards time-specific and individual-specific effects, fertility rates may have been confounded by unobserved
are included in Model 1 (Table 4) and Model 2 (Table 5). factors that simultaneously affect both economic growth
These results are compared with four different spatial and fertility decisions. Omitting relevant explanatory
econometric panel models: The SAR panel, SEM panel, variables can lead to biased and inconsistent estimates,
SAC panel, and SDM panel.
distorting the true effect of the independent variable
Table 4 displays the results of Model 1, which includes on the dependent variable (Angrist & Pischke, 2009).
only GRDP as an independent variable. All five models However, as additional control variables were introduced
demonstrate explanatory power, with R values ranging in subsequent models, these confounding effects were
2
from 12.5% to 14.7%, though the spatial interaction values mitigated, revealing the true positive association between
indicating the statistical significance of spatial dependence GRDP and fertility rates. This finding aligns with previous
differ across models. The spatial lag coefficient (ρ), which research suggesting that the relationship between
represents spatial autocorrelation of the dependent economic growth and fertility is not fixed but evolves
variable, is statistically significant at p<0.01 in the SAR and as economies develop (Doepke et al., 2023). In the early
SDM models but not in the SAC model. The spatial error stages of economic growth, rising opportunity costs, such
coefficient (λ), which captures spatial autocorrelation in as increased female labor force participation and higher
the residuals, is statistically significant at p<0.01 in both educational levels, may contribute to fertility decline. Yet,
the SEM and SAC models. as economies continue to develop, labor market stability,
In all models, GRDP shows a negative association improvements in gender equality, and the expansion of
with the regional total fertility rate, which is statistically family-supportive policies can help reverse this trend by
significant at p<0.01. This result is consistent with creating an environment more conducive to childbearing.
previous research suggesting that economic growth leads These findings indicate that, once key covariates are
individuals to prioritize their own labor participation and accounted for, the net effect of GRDP on fertility becomes
economic stability through continuous income generation, positive. This interpretation addresses research question
often leading to delayed or forgone childbirth (McDonald, 1, which suggests that an increase in income levels due to
2006). These findings align with the earlier bivariate economic growth has a positive effect on the total fertility
analysis (Figure 1), although Model 1 is limited in that rate when other conditions are held constant.
Volume 11 Issue 5 (2025) 126 https://doi.org/10.36922/ijps.8157