
Page 133 - IJPS-11-5
P. 133
International Journal of
Population Studies Regional disparities and fertility rates
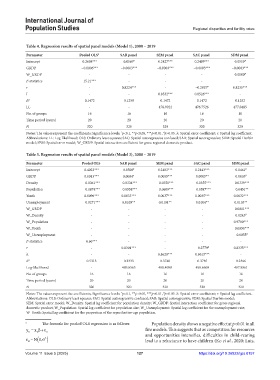
Table 4. Regression results of spatial panel models (Model 1), 2000 – 2019
Parameter Pooled OLS 3 SAR panel SEM panel SAC panel SDM panel
Intercept 0.2698*** 0.0569 # 0.2427*** 0.2489*** 0.0559 #
GRDP −0.0006*** −0.0003*** −0.0003*** −0.0003*** −0.0003***
W_GRDP - - - - 0.0000 #
F-statistics 15.21*** - - - -
r - 0.8224*** - −0.2857 # 0.8235***
l - - 0.8532*** 0.8526*** -
R 2 0.1472 0.1258 0.1472 0.1472 0.1252
LL - - 476.9922 476.7526 477.0485
No. of groups 16 16 16 16 16
Time period (years) 20 20 20 20 20
N 320 320 320 320 320
Notes: The values represent the coefficients; Significance levels: p<0.1, **p<0.05, ***p<0.01, p>0.05. λ: Spatial error coefficient; r: Spatial lag coefficient.
#
*
Abbreviations: LL: Log-likelihood; OLS: Ordinary least squares; SAC: Spatial autoregressive confused; SAR: Spatial autoregressive; SDM: Spatial Durbin
model; SEM: Spatial error model; W_GRDP: Spatial interaction coefficient for gross regional domestic product.
Table 5. Regression results of spatial panel models (Model 2), 2000 – 2019
Parameter Pooled OLS SAR panel SEM panel SAC panel SDM panel
Intercept 0.4022*** 0.0508 # 0.2403*** 0.2443*** 0.0461 #
GRDP 0.0013*** 0.0004* 0.0005*** 0.0005** 0.0003 #
Density −0.0361*** −0.0334*** −0.0350*** −0.0355*** −0.0339***
Population −0.1874*** −0.0558*** −0.0609*** −0.0587*** −0.0451**
Youth 0.0096*** 0.0033*** 0.0037*** 0.0035*** 0.0032***
Unemployment −0.0271*** 0.0105** 0.0101** 0.0104** 0.0103**
W_GRDP - - - - −0.0011***
W_Density - - - - 0.0243 #
W_Population - - - - 0.9700***
W_Youth - - - - −0.0050***
W_Unemployment - - - - −0.0055 #
F-statistics 6.66*** - - - -
r - 0.8301*** - −0.2779 # 0.8335***
λ - - 0.8620*** 0.8615*** -
R 2 0.5313 0.2333 0.3740 0.3785 0.2366
Log-likelihood - 489.6565 498.4088 498.6600 497.9861
No. of groups 16 16 16 16 16
Time period (years) 20 20 20 20 20
N 320 320 320 320 320
*
#
Notes: The values represent the coefficients; Significance levels: p<0.1, **p<0.05, ***p<0.01, p>0.05. λ: Spatial error coefficient; r: Spatial lag coefficient.
Abbreviations: OLS: Ordinary least squares; SAC: Spatial autoregressive confused; SAR: Spatial autoregressive; SDM: Spatial Durbin model;
SEM: Spatial error model; W_Density: Spatial lag coefficient for population density; W_GRDP: Spatial interaction coefficient for gross regional
domestic product; W_Population: Spatial lag coefficient for population size; W_Unemployment: Spatial lag coefficient for the unemployment rate;
W_Youth: Spatial lag coefficient for the proportion of the reproductive-age population.
3 The formula for pooled OLS regression is as follows: Population density shows a negative effect at p<0.01 in all
+
y = x βε five models. This suggests that as competition for resources
it it it and opportunities intensifies, difficulties in child-rearing
ε ~ N ( 0,σ 2 )
it lead to a reluctance to have children (Ko et al., 2020; Lutz,
Volume 11 Issue 5 (2025) 127 https://doi.org/10.36922/ijps.8157