Page 42 - IJPS-11-6
P. 42

International Journal of
            Population Studies                                                      Gender gaps in reporting limitations


              * s  = h  β +  β εε+ x  s ,  s  ~ (0,N  σ )  (IV)  3. Results
                                    2
             i    0  i    i  i
                                                               3.1. Rating of vignettes’ work limitations in the U.S.
                              s
                                                     v
              We assume that  ε  is independent of x  and  ε ; and   and Europe
                             i
                                               i
                                                     ij
            this latent variable is linked to the observed work limitation
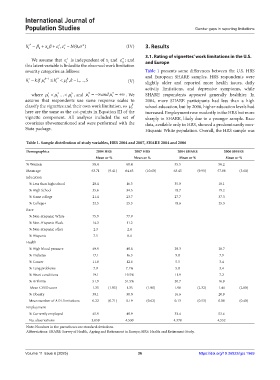
            severity categories as follows:                    Table 1 presents some differences between the U.S. HRS
                                                               and European SHARE samples. HRS respondents were
             s  =  kif  µ h  k −1  ≤  * s  < h  µ  k ,k  =  … 1, ,5
             i      i    i   i                         (V)     slightly  older  and  reported  more  health  issues,  daily
                                                               activity limitations, and depressive symptoms, while
                                                 5
                                       0
                         2
                     1
              where        , and    and     . We   SHARE respondents appeared generally healthier. In
                               5
                                       i
                                                 i
                     i
                         i
                               i
            assume that respondents use same response scales to   2004, more SHARE participants had less than a high
                                                         k
            classify the vignettes and their own work limitation, so  µ    school education, but by 2006, higher education levels had
                                                         i
            here are the same as the cut-points in Equation III of the   increased. Employment rose modestly in the HRS but more
            vignette component. All analyses included the set of   sharply in SHARE, likely due to a younger sample. Race
            covariates abovementioned and were performed with the   data, available only in HRS, showed a predominantly non-
            Stata package.                                     Hispanic White population. Overall, the HRS sample was
            Table 1. Sample distribution of study variables, HRS 2004 and 2007, SHARE 2004 and 2006
            Demographics                  2004 HRS        2007 HRS           2004 SHARE         2006 SHARE
                                          Mean or %       Mean or %          Mean or %           Mean or %
            % Women                     58.4           60.4                55.5               56.2
            Mean age                    63.71  (9.41)  64.63   (10.60)     63.45     (9.95)   57.88    (5.68)
            Education
             % Less than high school    20.4           16.3                35.0               18.1
             % High School              35.6           34.5                18.7               19.2
             % Some college             21.4           23.7                27.7               37.3
             % College+                 22.5           25.3                18.6               25.3
            Race
             % Non-Hispanic White       75.9           77.9
             % Non-Hispanic Black       14.3           11.2
             % Non-Hispanic other        2.3           2.4
             % Hispanic                  7.5           8.4
            Health
             % High blood pressure      49.9           49.8                29.3               28.7
             % Diabetes                 17.1           16.3                 9.0               7.9
             % Cancer                   11.8           12.6                 5.5               3.4
             % Lung problems             7.9           7.1%                 5.0               3.4
             % Heart conditions         19.1          19.5%                11.9               7.2
             % Arthritis                51.9          51.5%                20.7               16.9
              Mean CESD score           1.35   (1.95)  1.35    (1.90)      1.98      (2.32)   1.44     (2.00)
             % Obesity                  30.1           30.0                16.6               20.9
             Mean number of ADL limitations  0.22  (0.71)  0.19  (0.62)    0.13      (0.53)   0.08     (0.40)
            Employment
             % Currently employed       45.9           49.9                33.4               53.6
             No. observations           3.059         4.530                4.378              4.552
            Note: Numbers in the parentheses are standard deviations.
            Abbreviations: SHARE: Survey of Health, Ageing and Retirement in Europe; HRS: Health and Retirement Study.


            Volume 11 Issue 6 (2025)                        36                        https://doi.org/10.36922/ijps.1969
   37   38   39   40   41   42   43   44   45   46   47