
Page 43 - IJPS-11-6
P. 43
International Journal of
Population Studies Gender gaps in reporting limitations
slightly older and less healthy, while the SHARE sample Horizontally, the results are presented by cut-point on
showed gains in education and employment. the severity scale, ranging from “Mildly limited vs. Not
at all limited” (μ ) to “Cannot do any work vs. Severely
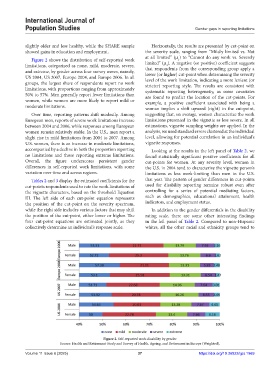
Figure 2 shows the distribution of self-reported work 1
limitations, categorized as none, mild, moderate, severe, limited” (μ ). A negative (or positive) coefficient suggests
4
that respondents from the corresponding group apply a
and extreme, by gender across four survey waves, namely, lower (or higher) cut-point when determining the severity
US 2004, US 2007, Europe 2004, and Europe 2006. In all level of the work limitation, indicating a more lenient (or
groups, the largest share of respondents report no work stricter) reporting style. The results are consistent with
limitations, with proportions ranging from approximately systematic reporting heterogeneity, as some covariates
50% to 57%. Men generally report fewer limitations than are found to predict the location of the cut-points. For
women, while women are more likely to report mild or example, a positive coefficient associated with being a
moderate limitations. woman implies a shift upward (right) in the cut-point,
Over time, reporting patterns shift modestly. Among suggesting that, on average, women characterize the work
European men, reports of severe work limitations increase limitations presented in the vignette as less severe. In all
between 2004 and 2006, while responses among European estimations, vignette sampling weights are applied. In the
women remain relatively stable. In the U.S., men report a analysis, we used standard errors clustered at the individual
slight rise in mild limitations from 2004 to 2007. Among level, allowing for potential correlation in an individual’s
U.S. women, there is an increase in moderate limitations, vignette responses.
accompanied by a decline in both the proportion reporting Looking at the results in the left panel of Table 2, we
no limitations and those reporting extreme limitations. found statistically significant positive coefficients for all
Overall, the figure underscores persistent gender cut-points for women. At any severity level, women in
differences in self-reported work limitations, with some the U.S. in 2004 tend to characterize the vignette person’s
variation over time and across regions. limitations as less work-limiting than men in the U.S.
Tables 2 and 3 display the estimated coefficients for the that year. The pattern of gender differences in cut-points
cut-points respondents used to rate the work limitations of used for disability reporting remains robust even after
the vignette characters, based on the threshold Equation controlling for a series of potential mediating factors,
III. The left side of each cut-point equation represents such as demographics, educational attainment, health
the position of the cut-point on the severity spectrum, indicators, and employment status.
while the right side includes various factors that may shift In addition to the gender differentials in the disability
the position of the cut-point, either lower or higher. The rating scale, there are some other interesting findings
four cut-point equations are estimated jointly, as they in the left panel of Table 2. Compared to non-Hispanic
collectively determine an individual’s response scale. whites, all the other racial and ethnicity groups tend to
Figure 2. Self-reported work disability by gender
Source: Health and Retirement Study and Survey of Health, Ageing, and Retirement in Europe (Weighted).
Volume 11 Issue 6 (2025) 37 https://doi.org/10.36922/ijps.1969