
Page 45 - IJPS-11-6
P. 45
International Journal of
Population Studies Gender gaps in reporting limitations
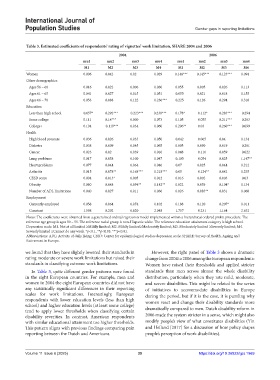
Table 3. Estimated coefficients of respondents’ rating of vignettes’ work limitation, SHARE 2004 and 2006
2004 2006
mu1 mu2 mu3 mu4 mu1 mu2 mu3 mu4
M1 M2 M3 M4 M1 M2 M3 M4
Women −0.006 0.042 0.02 0.029 0.146*** 0.145*** 0.123*** 0.094
Other demographics
Ages 56 – 60 0.016 0.022 0.006 −0.030 0.055 0.005 −0.026 0.113
Ages 61 – 65 0.041 0.027 0.015 0.051 −0.055 0.021 −0.018 0.155
Ages 66 – 70 0.053 0.088 0.122 0.236*** −0.225 0.126 0.294 0.318
Education
Less than high school −0.057* −0.292*** −0.223*** −0.230*** 0.178* −0.112* −0.283*** −0.294
Some college −0.111 −0.14*** 0.000 −0.073 0.105 −0.055 −0.211*** −0.203
College+ −0.104 −0.119*** −0.034 −0.060 0.206** −0.03 −0.260*** −0.099
Health
High blood pressure −0.036 −0.026 0.033 0.050 −0.042 −0.065 −0.04 0.134
Diabetes 0.038 −0.009 −0.045 −0.065 0.095 0.090 0.019 −0.201
Cancer −0.023 −0.02 −0.039 0.016 0.048 −0.110 0.059 −0.022
Lung problems −0.017 0.058 0.100 0.047 −0.105 −0.054 0.025 1.147**
Heart problems −0.077 −0.044 −0.064 0.046 −0.07 0.025 0.044 0.212
Arthritis 0.015 0.078** 0.168*** 0.218*** −0.05 −0.124** −0.042 0.235
CESD score −0.004 −0.013* 0.005 0.012 0.016 0.002 −0.003 −0.03
Obesity 0.080 −0.048 −0.094** −0.142** 0.022 0.059 0.104* 0.134
Number of ADL limitations 0.040 0.027 0.011 −0.036 0.026 0.083** 0.031 0.068
Employment
Currently employed 0.058 0.064 −0.074 −0.102 0.188 0.120 0.207* 0.011
Constant −1.598 −0.202 0.820 2.048 −1.757 −0.231 1.164 2.632
Notes: The coefficients were obtained from a generalized ordinal regression model implemented within a hierarchical ordered probit procedure. The
reference age group is ages 50 – 55. The reference racial group is non-Hispanic white. The reference education attainment category is high school.
Depression scale: M1. Not at all limited ≥Mildly limited; M2. Mildly limited≥Moderately limited; M3. Moderately limited ≥Severely limited; M4.
Severely limited ≥Cannot do any work. *p<0.1, **p<0.05, ***p<0.01.
Abbreviations: ADL: Activity of daily living; CESD: Center for epidemiological studies depression scale; SHARE: Survey of Health, Ageing and
Retirement in Europe.
we found that they have slightly lowered their standards in However, the right panel of Table 3 shows a dramatic
rating moderate or severe work limitations but raised their change from 2004 to 2006 among the European respondents:
standards in classifying extreme work limitations. Women have raised their thresholds and applied stricter
In Table 3, quite different gender patterns were found standards than men across almost the whole disability
in the eight European countries. For example, men and distribution, particularly when they rate mild, moderate,
women in 2004 the eight European countries did not have and severe disabilities. This might be related to the series
any statistically significant differences in their reporting of initiatives to accommodate disabilities in Europe
scales for work limitations. Interestingly, European during the period, but if it is the case, it is puzzling why
respondents with lower education levels (less than high women react and change their disability standards more
school) and higher education levels (at least some college)
tend to apply lower thresholds when classifying certain dramatically compared to men. Dutch disability reform in
disability severities. In contrast, American respondents 2006 made the system stricter in a sense, which might also
with similar educational attainment use higher thresholds. modify people’s view of what constitutes disabilities (Yin
This pattern aligns with previous findings comparing pain and Heiland [2017] for a discussion of how policy shapes
reporting between the Dutch and Americans. people’s perception of work disabilities).
Volume 11 Issue 6 (2025) 39 https://doi.org/10.36922/ijps.1969