Page 47 - IJPS-11-6
P. 47

International Journal of
            Population Studies                                                      Gender gaps in reporting limitations


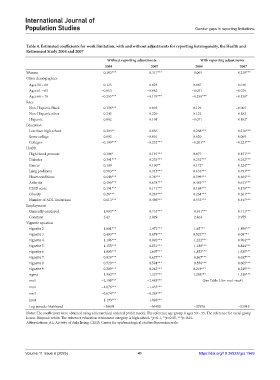
            Table 4. Estimated coefficients for work limitation, with and without adjustments for reporting heterogeneity, the Health and
            Retirement Study 2004 and 2007
                                               Without reporting adjustments          With reporting adjustments
                                              2004               2007               2004               2007
            Women                           −0.183***           −0.317***          −0.065            −0.219***
            Other demographics
             Ages 56 – 60                    0.125               0.025             0.087              0.040
             Ages 61 – 65                   −0.063              −0.062             −0.051            −0.039
             Ages 66 – 70                   −0.255***           −0.178***          −0.250***         −0.138*
            Race
             Non-Hispanic Black              0.336***            0.005             0.129             −0.005
             Non-Hispanic other              0.245               0.220             0.122              0.182
             Hispanic                        0.082               0.104             −0.071             0.182*
            Education
             Less than high school           0.204**             0.056             0.268***           0.210***
             Some college                    0.002              −0.001             0.020              0.069
             College+                       −0.199***           −0.232***          −0.201**          −0.223***
            Health
             High blood pressure             0.106*              0.191***          0.077              0.151***
             Diabetes                        0.301***            0.233***          0.252***           0.242***
             Cancer                          0.109               0.160**           0.172*             0.224***
             Lung problems                   0.583***            0.745***          0.632***           0.753***
             Heart conditions                0.648***            0.38***           0.599***           0.464***
             Arthritis                       0.495***            0.678***          0.485***           0.611***
             CESD score                      0.191***            0.171***          0.168***           0.178***
             Obesity                         0.28***             0.283***          0.264***           0.261***
             Number of ADL limitations       0.613***            0.496***          0.533***           0.447***
            Employment
             Currently employed             −1.004***           −0.733***          −0.931***         −0.711***
             Constant                       −2.43               −2.829             −2.464            −2.955
            Vignette equation
             vignette 2                     −1.601***           −1.472***          −1.65***          −1.499***
             vignette 3                      0.493***           −0.078***          0.522***          −0.08***
             vignette 4                     −1.196***           −0.892***          −1.222***         −0.904***
             vignette 5                     −1.155***           −0.831***          −1.188***         −0.844***
             vignette 6                     −1.805***           −1.607***          −1.853***         −1.635***
             vignette 7                     −0.829***           −0.627***          −0.867***         −0.637***
             vignette 8                     −0.529***           −0.594***          −0.556***         −0.605***
             vignette 9                      0.209***            0.242***          0.219***           0.249***
             sigma                           1.302***            1.327***          1.288***           1.339***
             mu1                            −2.108***           −2.483***              (See Table 2 for mu1-mu4)
             mu2                            −1.076***           −1.455***
             mu3                            −0.074***           −0.283***
             mu4                             1.193***            1.028***
             Log pseudo-likelihood           −38691              −56400            −37978             −55919
            Notes: The coefficients were obtained using a hierarchical ordered probit model. The reference age group is ages 50 – 55. The reference for racial group
            is non-Hispanic white. The reference education attainment category is high school. *p<0.1, **p<0.05, ***p<0.01.
            Abbreviations: AL: Activity of daily living; CESD: Center for epidemiological studies depression scale.


            Volume 11 Issue 6 (2025)                        41                        https://doi.org/10.36922/ijps.1969
   42   43   44   45   46   47   48   49   50   51   52