
Page 44 - IJPS-11-6
P. 44
International Journal of
Population Studies Gender gaps in reporting limitations
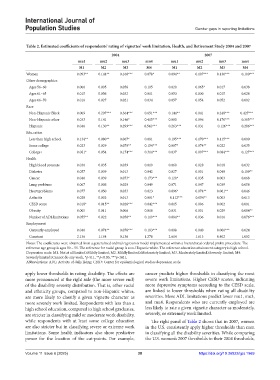
Table 2. Estimated coefficients of respondents’ rating of vignettes’ work limitation, Health, and Retirement Study 2004 and 2007
2004 2007
mu1 mu2 mu3 mu4 mu1 mu2 mu3 mu4
M1 M2 M3 M4 M1 M2 M3 M4
Women 0.093** 0.144** 0.160*** 0.078* 0.094** 0.107*** 0.130*** 0.100***
Other demographics
Ages 56–60 0.000 −0.005 −0.056 −0.105 0.020 0.065* 0.017 −0.038
Ages 61–65 −0.015 0.056 0.032 −0.011 0.053 0.030 −0.015 −0.028
Ages 66–70 0.016 0.027 −0.021 −0.034 0.057 0.054 0.052 0.002
Race
Non-Hispanic Black 0.009 −0.207*** −0.364*** −0.651*** 0.144** −0.041 −0.248*** −0.427***
Non-Hispanic other −0.033 −0.141 −0.146* −0.415*** 0.080 −0.096 −0.170*** −0.305***
Hispanic −0.046 −0.130** −0.299*** −0.540*** 0.263*** −0.031 −0.126*** −0.286***
Edu.cation
Less than high school 0.134** 0.080** 0.067* −0.081 0.195*** 0.170*** 0.115*** 0.000
Some college −0.023 0.029 0.079** 0.154*** 0.087* 0.074** 0.022 0.035
College+ −0.081* 0.054 0.174*** 0.314*** −0.037 0.097*** 0.084*** 0.127***
Health
High blood pressure −0.030 −0.035 −0.039 −0.019 −0.060 −0.028 −0.018 0.032
Diabetes −0.057 −0.039 −0.013 −0.042 −0.027 −0.001 0.048 0.109**
Cancer 0.040 0.039 0.073* 0.173*** 0.120* 0.035 −0.003 0.068
Lung problems 0.067 −0.006 0.029 0.049 −0.071 −0.047 0.039 0.058
Heart problems −0.077 −0.050 −0.033 0.023 0.096* 0.074** 0.061** 0.046
Arthritis −0.028 −0.003 0.013 0.081* −0.112*** −0.054** −0.003 0.013
CESD score −0.018* −0.015** −0.026*** −0.042*** 0.015 0.006 −0.002 0.001
Obesity −0.005 −0.011 −0.006 −0.016 −0.031 0.001 −0.029 −0.084**
Number of ADL limitations −0.055** −0.022 −0.050** −0.119*** −0.084** −0.036 −0.016 −0.076***
Employment
Currently employed 0.040 0.074** 0.076*** 0.183*** 0.008 0.040 0.066*** 0.024
Constant −2.136 −1.164 −0.136 1.278 −2.614 −1.613 −0.402 1.002
Notes: The coefficients were obtained from a generalized ordinal regression model implemented within a hierarchical ordered probit procedure. The
reference age group is ages 50 – 55. The reference for racial group is non-Hispanic white. The reference education attainment category is high school.
Depression scale: M1. Not at all limited≥Mildly limited; M2. Mildly limited≥Moderately limited; M3. Moderately limited≥Severely limited; M4.
Severely limited≥Cannot do any work. *p<0.1, **p<0.05, ***p<0.01.
Abbreviations: ADL: Activity of daily living; CESD: Center for epidemiological studies depression scale.
apply lower thresholds in rating disability. The effects are cancer predicts higher thresholds in classifying the most
more pronounced at the right side (the more severe end) severe work limitations. Higher CESD scores, indicating
of the disability severity distribution. That is, other racial more depressive symptoms according to the CESD scale,
and ethnicity groups, compared to non-Hispanic whites, are linked to lower thresholds when rating all disability
are more likely to classify a given vignette character as severities. More ADL limitations predict lower mu1, mu3,
more severely work limited. Respondents with less than a and mu4. Respondents who are currently employed are
high school education, compared to high school graduates, less likely to rate a given vignette character as moderately,
are stricter in classifying mild or moderate work disability, severely, or extremely work limited.
while respondents with at least some college education The right panel of Table 2 shows that in 2007, women
are also stricter but in classifying severe or extreme work in the U.S. consistently apply higher thresholds than men
limitations. Some health indicators also show predictive in classifying all the disability severities. While comparing
power for the location of the cut-points. For example, the U.S. women’s 2007 thresholds to their 2004 thresholds,
Volume 11 Issue 6 (2025) 38 https://doi.org/10.36922/ijps.1969