
Page 48 - IJPS-11-6
P. 48
International Journal of
Population Studies Gender gaps in reporting limitations
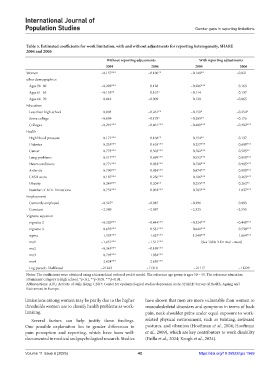
Table 5. Estimated coefficients for work limitation, with and without adjustments for reporting heterogeneity, SHARE
2004 and 2006
Without reporting adjustments With reporting adjustments
2004 2006 2004 2006
Women −0.157*** −0.160** −0.149** −0.021
other demographics
Ages 56–60 −0.220*** 0.128 −0.206*** 0.163
Ages 61–65 −0.155** 0.167* −0.114 0.137
Ages 66–70 0.042 −0.009 0.129 −0.065
Education
Less than high school 0.003 −0.261** −0.150* −0.254*
Some college −0.099 −0.179* −0.205** −0.176
College+ −0.291*** −0.461*** −0.400*** −0.392***
Health
High blood pressure 0.171*** 0.168** 0.154** 0.137
Diabetes 0.255*** 0.618*** 0.257*** 0.699***
Cancer 0.773*** 0.503*** 0.762*** 0.505**
Lung problems 0.517*** 0.699*** 0.552*** 0.810***
Heart conditions 0.771*** 0.932*** 0.728*** 0.985***
Arthritis 0.790*** 0.934*** 0.874*** 0.900***
CESD score 0.187*** 0.256*** 0.186*** 0.263***
Obesity 0.249*** 0.204** 0.255*** 0.262**
Number of ADL limitations 0.752*** 0.962*** 0.765*** 1.037***
Employment
Currently employed −0.327* −0.087 −0.296 0.083
Constant −2.380 −2.397 −2.325 −2.555
Vignette equation
vignette 2 −0.320*** −0.444*** −0.324*** −0.449***
vignette 3 0.635*** 0.531*** 0.641*** 0.538***
sigma 1.533*** 1.637*** 1.549*** 1.664***
mu1 −1.651*** −1.511*** (See Table 3 for mu1−mu4)
mu2 −0.345*** −0.199***
mu3 0.793*** 1.034***
mu4 2.024*** 2.655***
Log pseudo-likelihood −21243 −11310 −21117 −11229
Notes: The coefficients were obtained using a hierarchical ordered probit model. The reference age group is ages 50 – 55. The reference education
attainment category is high school. *p<0.1, **p<0.05, ***p<0.01.
Abbreviations: ADL: Activity of daily living; CESD: Center for epidemiological studies depression scale; SHARE: Survey of Health, Ageing and
Retirement in Europe.
limitations among women may be partly due to the higher have shown that men are more vulnerable than women to
thresholds women use to classify health problems as work- musculoskeletal disorders and symptoms in terms of back
limiting. pain, neck-shoulder pains under equal exposure to work-
Several factors can help justify these findings. related physical environment, such as twisting, awkward
One possible explanation lies in gender differences in postures, and vibration (Hooftman et al., 2004; Hooftman
pain perception and reporting, which have been well- et al., 2009), which are key contributors to work disability
documented in medical and psychological research. Studies (Failla et al., 2024; Keogh et al., 2024).
Volume 11 Issue 6 (2025) 42 https://doi.org/10.36922/ijps.1969