
Page 74 - IJPS-11-6
P. 74
International Journal of
Population Studies The paradox of urban decline in India
experienced a population decline in many of its parts for of shrinking cities in developing countries (Long &
more than 2 years and has also experienced the economic Gao, 2019), which is concerning given that India has
change (Hollander et al., 2009a). However, due to data a substantial number of shrinking or declining urban
unavailability, many studies considered population decline centers. One-fifth of all shrinking cities in Asia are located
as the key indicator of urban shrinkage (Hollander et al., in India, according to the UN-Habitat (2008) report. Thus,
2009b; Long & Gao, 2019). this study aims to understand the spatial growth pattern
According to statistics from the World Urbanization of urban centers in India, identify the spatial locations of
Prospect 2018, population decline is a growing concern declining and shrinking urban centers, and examine the
in cities worldwide, with a large share of cities located in factors associated with population decline in the Indian
Asian and European countries experiencing this trend context.
(Pourahmad et al., 2016). This phenomenon is prevalent 2. Data and methods
in European and American countries, while paradoxically,
developing countries are also experiencing a similar trend This study has used the latest census statistics given by
(Richardson & Nam, 2014). Despite steady urban growth the Census of India to achieve the objectives. Different
and relatively low levels of urbanization, many urban aspects of city-level information, derived from census
centers are still experiencing a decline in population datasets, were used in this study, including demographic
(UN-Habitat, 2008). The regional pattern shows that 54% information such as population count, child population,
of urban areas in Europe (of which 42% are large cities), and older population, and several local information
13% in the United States (Wiechmann & Pallagst, 2012; including area, civic status, the nearest city, and changes
Haase et al., 2016), and 10% of urban centers in developing in the boundary. Further information on the origin year
countries are experiencing urban shrinkage. UN-Habitat of the urban center, agglomeration setting, and changes
(2008) conducted the first systematic study on shrinking in boundary was also available. The above-mentioned
cities in developing countries, which found that 143 urban information was available in the town directory files
centers out of 1,408 cities experienced a population decline and decadal variation table (A-04) for the years 1901 to
between 1990 and 2000. Approximately two-thirds of these 2011. The geographic location of the urban centers was
cities are located in Asian countries such as Israel, Iran, determined from Google Earth by searching with the
China, India, and North Korea (Ganapati, 2014; Lee et al., respective names and localities.
2016; Pourahmad et al., 2016; Li & Mykhnenko, 2018). In In this study, urban decline is defined as the occurrence
Asia, China (58%) and India (18%) contribute the majority of population decline in urban centers. Urban decline
share of shrinking cities (UN-Habitat, 2008). was measured by calculating the population growth rate.
From a global perspective, urban shrinkage is a unique Annual exponential growth rate (AEGR) was calculated to
phenomenon with heterogeneous drivers (Ma et al., 2020). track the population growth pattern of each urban center
Berry (1977) argues that the period of shrinkage is an integral in India during the period of 1911 to 2011. Further, it was
part of urban growth and development. Haase et al. (2014) used to present the growth trajectory of urban centers in
explain that urban shrinkage is intrinsic in the process of India. Later, urban centers were classified into different
the city life cycle, which occurs through suburbanization, growth categories based on the AEGR, and primarily,
capital disinvestment, deindustrialization, and a decline in growth rates of 2001–2011 and 1991–2001 were utilized in
natural increase in urban population. In the life cycle of an further analysis (Table 1).
individual city, there are periods of fast growth, followed
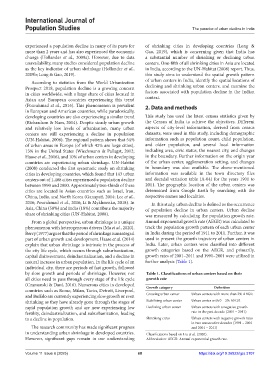
by slow growth and periods of shrinkage. However, not Table 1. Classifications of urban centers based on their
all cities need to pass through every stage of the life cycle growth rate
(Czamanski & Dani, 2016). Numerous cities in developed Growth category Definition
countries such as Rome, Milan, Turin, Detroit, Liverpool,
and Buffalo are currently experiencing slow growth or even Growing urban center Urban centers with more than 2% AEGR
shrinking as they have already gone through the stages of Stabilizing urban center Urban center with 0 – 2% AEGR
rapid population growth and are now experiencing low Declining urban center Urban centers with a negative growth
fertility, deindustrialization, and suburbanization, leading rate in the past decade (2001 – 2011)
to a decline in population. Shrinking cities Urban centers with negative growth rates
in two consecutive decades (1991 – 2001
The research community has made significant progress and 2001 – 2011)
in understanding urban shrinkage in developed countries. Classifications based on Liu et al. (2020).
However, significant gaps remain in our understanding Abbreviation: AEGR: Annual exponential growth rate.
Volume 11 Issue 6 (2025) 68 https://doi.org/10.36922/ijps.3107