
Page 50 - IJPS-2-1
P. 50
Life expectancy at birth and life disparity: an assessment of sex differentials in mortality in India
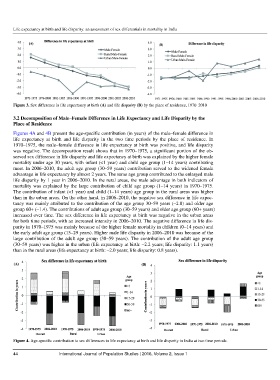
Figure 3. Sex difference in life expectancy at birth (A) and life disparity (B) by the place of residence, 1970–2010
3.2 Decomposition of Male–Female Difference in Life Expectancy and Life Disparity by the
Place of Residence
Figures 4A and 4B present the age-specific contribution (in years) of the male–female difference in
life expectancy at birth and life disparity in the two time periods by the place of residence. In
1970–1975, the male–female difference in life expectancy at birth was positive, and life disparity
was negative. The decomposition result shows that in 1970–1975, a significant portion of the ob-
served sex difference in life disparity and life expectancy at birth was explained by the higher female
mortality under age 30 years, with infant (<1 year) and child age group (1–14 years) contributing
most. In 2006–2010, the adult age group (30–59 years) contribution served to the widened female
advantage in life expectancy by almost 2 years. The same age group contributed to the enlarged male
life disparity by 1 year in 2006–2010. In the rural areas, the male advantage in both indicators of
mortality was explained by the large contribution of child age group (1–14 years) in 1970–1975.
The contribution of infant (<1 year) and child (1–14 years) age group in the rural areas was higher
than in the urban areas. On the other hand, in 2006–2010, the negative sex difference in life expec-
tancy was mainly attributed to the contribution of the age group 30–59 years (–2.0) and older age
group 60+ (–1.4). The contributions of adult age group (30–59 years) and older age group (60+ years)
increased over time. The sex difference in life expectancy at birth was negative in the urban areas
for both time periods, with an increased intensity in 2006–2010. The negative difference in life dis-
parity in 1970–1975 was mainly because of the higher female mortality in children (0–14 years) and
the early adult age group (15–29 years). Higher male life disparity in 2006–2010 was because of the
large contribution of the adult age group (30–59 years). The contribution of the adult age group
(30–59 years) was higher in the urban (life expectancy at birth: –2.2 years; life disparity: 1.1 years)
than in the rural areas (life expectancy at birth: –2.0 years; life disparity: 0.8 years).
Figure 4. Age-specific contribution to sex differences in life expectancy at birth and life disparity in India at two time periods.
44 International Journal of Population Studies | 2016, Volume 2, Issue 1