
Page 52 - IJPS-2-1
P. 52
Life expectancy at birth and life disparity: an assessment of sex differentials in mortality in India
transition, that is, the male–female difference in life expectancy or life disparity did not change the
sign over the periods.
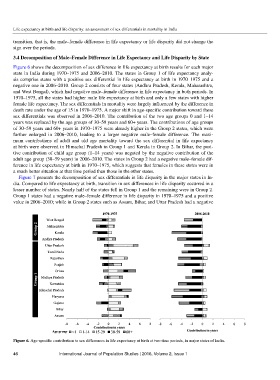
3.4 Decomposition of Male–Female Difference in Life Expectancy and Life Disparity by State
Figure 6 shows the decomposition of sex difference in life expectancy at birth results for each major
state in India during 1970–1975 and 2006–2010. The states in Group 1 of life expectancy analy-
sis comprise states with a positive sex differential in life expectancy at birth in 1970–1975 and a
negative one in 2006–2010. Group 2 consists of four states (Andhra Pradesh, Kerala, Maharashtra,
and West Bengal), which had negative male–female difference in life expectancy in both periods. In
1970–1975, all the states had higher male life expectancy at birth and only a few states with higher
female life expectancy. The sex differentials in mortality were largely influenced by the difference in
death rate under the age of 15 in 1970–1975. A major shift in age-specific contribution toward these
sex differentials was observed in 2006–2010. The contribution of the two age groups 0 and 1–14
years was replaced by the age groups of 30–59 years and 60+ years. The contributions of age groups
of 30–59 years and 60+ years in 1970–1975 were already higher in the Group 2 states, which were
further enlarged in 2006–2010, leading to a larger negative male–female difference. The maxi-
mum contributions of adult and old age mortality toward the sex differential in life expectancy
at birth were observed in Himachal Pradesh in Group 1 and Kerala in Group 2. In Bihar, the posi-
tive contribution of child age group (1–14 years) was negated by the negative contribution of the
adult age group (30–59 years) in 2006–2010. The states in Group 2 had a negative male–female dif-
ference in life expectancy at birth in 1970–1975, which suggests that females in these states were in
a much better situation at that time period than those in the other states.
Figure 7 presents the decomposition of sex differentials in life disparity in the major states in In-
dia. Compared to life expectancy at birth, transition in sex differences in life disparity occurred in a
lesser number of states. Nearly half of the states fell in Group 1 and the remaining were in Group 2.
Group 1 states had a negative male–female difference in life disparity in 1970–1975 and a positive
value in 2006–2010; while in Group 2 states such as Assam, Bihar, and Uttar Pradesh had a negative
Figure 6. Age-specific contribution to sex differences in life expectancy at birth at two time periods, in major states of India.
46 International Journal of Population Studies | 2016, Volume 2, Issue 1