
Page 51 - IJPS-2-1
P. 51
Akansha Singh and Laishram Ladusingh
3.3 Male-Female Difference in Life Expectancy and Life Disparity by State Group
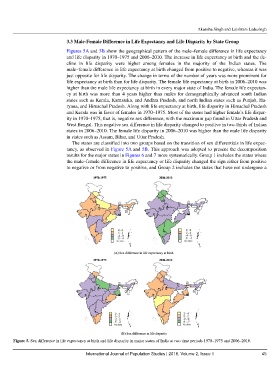
Figures 5A and 5B show the geographical pattern of the male–female difference in life expectancy
and life disparity in 1970–1975 and 2006–2010. The increase in life expectancy at birth and the de-
cline in life disparity were higher among females in the majority of the Indian states. The
male–female difference in life expectancy at birth changed from positive to negative, whereas it was
just opposite for life disparity. The change in terms of the number of years was more prominent for
life expectancy at birth than for life disparity. The female life expectancy at birth in 2006–2010 was
higher than the male life expectancy at birth in every major state of India. The female life expectan-
cy at birth was more than 4 years higher than males for demographically advanced south Indian
states such as Kerala, Karnataka, and Andhra Pradesh, and north Indian states such as Punjab, Ha-
ryana, and Himachal Pradesh. Along with life expectancy at birth, life disparity in Himachal Pradesh
and Kerala was in favor of females in 1970–1975. Most of the states had higher female’s life dispar-
ity in 1970–1975, that is, negative sex difference, with the maximum gap found in Uttar Pradesh and
West Bengal. This negative sex difference in life disparity changed to positive in two-thirds of Indian
states in 2006–2010. The female life disparity in 2006–2010 was higher than the male life disparity
in states such as Assam, Bihar, and Uttar Pradesh.
The states are classified into two groups based on the transition of sex differentials in life expec-
tancy, as observed in Figure 5A and 5B. This approach was adopted to present the decomposition
results for the major states in Figures 6 and 7 more systematically. Group 1 includes the states where
the male–female difference in life expectancy or life disparity changed the sign either from positive
to negative or from negative to positive, and Group 2 includes the states that have not undergone a
Figure 5. Sex difference in life expectancy at birth and life disparity in major states of India at two time periods 1970–1975 and 2006–2010.
International Journal of Population Studies | 2016, Volume 2, Issue 1 45