
Page 120 - IJPS-2-2
P. 120
Utilization of maternal and child health care services in North and South India: does spousal violence matter?
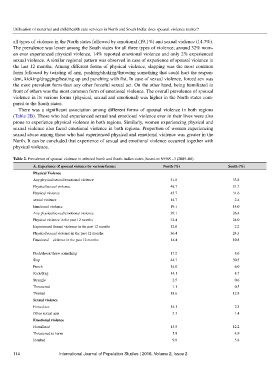
all types of violence in the North states followed by emotional (19.1%) and sexual violence (14.7%).
The prevalence was lesser among the South states for all three types of violence; around 32% wom-
en ever experienced physical violence, 14% reported emotional violence and only 2% experienced
sexual violence. A similar regional pattern was observed in case of experience of spousal violence in
the last 12 months. Among different forms of physical violence, slapping was the most common
form followed by twisting of arm, pushing/shaking/throwing something that could hurt the respon-
dent, kicking/dragging/beating up and punching with fist. In case of sexual violence, forced sex was
the most prevalent form than any other forceful sexual act. On the other hand, being humiliated in
front of others was the most common form of emotional violence. The overall prevalence of spousal
violence in its various forms (physical, sexual and emotional) was higher in the North states com-
pared to the South states.
There was a significant association among different forms of spousal violence in both regions
(Table 2B). Those who had experienced sexual and emotional violence ever in their lives were also
prone to experience physical violence in both regions. Similarly, women experiencing physical and
sexual violence also faced emotional violence in both regions. Proportion of women experiencing
sexual abuse among those who had experienced physical and emotional violence was greater in the
North. It can be concluded that experience of sexual and emotional violence occurred together with
physical violence.
Table 2. Prevalence of spousal violence in selected North and South Indian states, based on NFHS –3 (2005–06).
A. Experience of spousal violence by various forms: North (%) South (%)
Physical Violence
Any physical/sexual/emotional violence 51.6 33.8
Physical/sexual violence 48.7 31.7
Physical violence 45.7 31.6
sexual violence 14.7 2.4
Emotional violence 19.1 14.0
Any physical/sexual/emotional violence 39.1 26.4
Physical violence in the past 12 months 32.4 24.0
Experienced Sexual violence in the past 12 months 12.0 2.2
Physical/sexual violence in the past 12 months 36.4 24.3
Emotional violence in the past 12 months 14.4 10.8
Push/shook/threw something 17.2 8.6
Slap 44.7 30.5
Punch 14.0 6.0
Kick/drag 14.1 8.7
Strangle 2.5 0.6
Threatened 1.1 0.5
Twisted 18.6 12.8
Sexual violence
Forced sex 14.1 2.3
Other sexual acts 5.3 1.4
Emotional violence
Humiliated 15.5 12.2
Threatened to harm 5.9 4.9
Insulted 9.8 5.8
114 International Journal of Population Studies | 2016, Volume 2, Issue 2