
Page 134 - IJPS-3-1
P. 134
Public pensions, economic development, and the labor force participation of older adults in Latin America in 1990–2010
Table 2. Summary measures of public pension coverage: Ratio of contributors by wage earners and the ratio of
beneficiaries by population aged 65 and above, selected Latin American countries, 1990–2005
Ratio of Contributors/Wage-Earners Ratio of Beneficiaries/Population
Countries Mean SD Max Min Mean SD Max Min
Argentina 67.29 8.37 83.00 52.36 74.56 7.05 90.43 58.91
Bolivia 33.98 4.43 40.62 28.21 22.24 7.84 38.08 14.71
Brazil 69.57 2.14 73.27 65.82 79.98 7.34 87.12 56.81
Chile 80.66 3.59 89.84 78.09 65.16 4.65 73.04 57.23
Colombia 51.22 5.47 59.68 42.76 17.30 5.33 23.88 0.39
Costa Rica 78.11 1.81 82.28 75.11 34.13 5.77 43.01 25.30
Dominican Republic 53.91 9.99 66.73 40.37 11.78 1.05 13.72 10.21
Ecuador 50.74 9.55 64.18 39.23 18.43 2.39 22.38 13.68
El Salvador 50.53 2.74 53.94 44.02 13.86 1.27 16.19 11.96
Guatemala 41.01 4.63 46.15 37.18 13.44 2.14 15.41 11.17
Honduras 42.93 0.92 43.87 42.04 4.53 0.64 5.54 3.10
Mexico 52.86 4.61 56.46 38.58 19.40 4.25 25.21 11.46
Nicaragua 37.82 5.10 44.90 32.86 18.72 0.00 18.72 18.72
Panama 72.10 2.11 75.14 70.56 40.21 3.52 44.97 34.16
Paraguay 32.36 3.21 38.52 27.25 21.00 6.88 35.40 12.90
Peru 34.77 3.95 40.93 30.41 27.13 1.78 31.52 24.50
Uruguay 76.99 3.24 83.73 73.10 82.60 9.99 88.53 54.78
Venezuela 65.32 2.94 71.49 61.07 24.07 3.73 31.27 18.78
Source: Rofman and Carranza (2005)
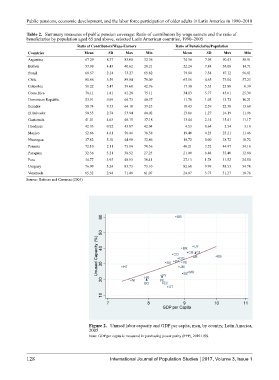
Figure 2. Unused labor capacity and GDP per capita, men, by country, Latin America,
2005
Note: GDP per capita is measured in purchasing power parity (PPP), 2010 US$.
128 International Journal of Population Studies 2017, Volume 3, Issue 1