
Page 135 - IJPS-3-1
P. 135
Queiroz BL
Despite the abovementioned limitations of these measures, it is important to
compare Latin American countries with OECD countries from the Gruber and Wise
study. As Gruber and Wise (1999) pointed out, there was a wide variation across
OECD countries around year 1995 with the unused labor capacity ranging from 22%
in Japan to 67% in Belgium for ages 55–65 and the percentage of males out of the
labor force at age 59 from 13% in Japan to 58% in Belgium. The unused labor capacity
in several Latin American countries (Uruguay, Brazil, Argentina, Chile, Costa Rica,
and Colombia) were similar to those observed in the United States (37%) and Sweden
(35%). The main conclusion of the Gruber and Wise study is that there was a strong
relationship between unused capacity and pension programs incentives to retire in
OECD countries in the 1990s. The present paper did not apply the same methodology
used by Gruber and Wise, but the descriptive analysis presented here also indicated
that a similar behavior was observed in Latin America.
The relation between the unused capacity and GDP per capita is positive. As income
increases, the unused capacity also increases. The results indicate that in countries
with low income per capita, most individuals remain in the labor force until age 65
or beyond (or until they are not able to work). Relation from Figure 2 indicates that,
as the economy develops, there is a change in the composition of employment and
emergence of old-age assistance programs, and individuals start to leave the labor
force at younger ages. The level of economic development is also associated with
demographic transition and an older population age structure.
3.3 Retirement Hazard Rates
Another useful way to focus on timing of retirement and its changes is to calculate
retirement hazard rates. The retirement hazard rate shows whether there is a preferable
retirement age, and it helps to understand the effects of the social security system in the
patterns of retirement. When these rates are being estimated from cross-sectional data,
they do not represent the actual labor market transitions of individuals (Gruber and
Wise, 1999; Costa, 1998; Hurd, 1990). In most cases of the analyses, the retirement
hazard rate is simply the percentage decline in the proportion of individuals in the
labor force between age x and x+1 in a particular year (Costa, 1998). In this paper, the
retirement hazard rate was also estimated using a synthetic cohort approach, namely,
by comparing labor force participation rates of individuals aged 50–55 in 1990 to those
aged 55–60 in 1995 (i.e., the latter was divided by the former) and following similar
procedure for other age groups.
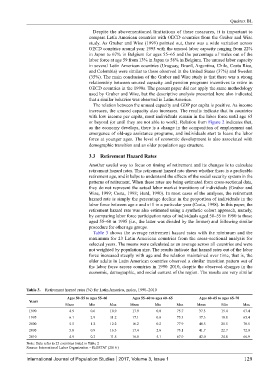
Table 3 shows the average retirement hazard rates with the minimum and the
maximum for 23 Latin American countries from the cross-sectional analysis for
selected years. The means were calculated as an average across all countries and were
not weighted by population size. The results indicate that hazard rates out of the labor
force increased steeply with age and the relation maintained over time, that is, the
older adults in Latin American countries observed a similar transition pattern out of
the labor force across countries in 1990–2010, despite the observed changes in the
economic, demographic, and social context of the region. The results are very similar
Table 3. Retirement hazard rates (%) for Latin America, males, 1990–2010
Ages 50–55 to ages 55–60 Ages 55–60 to ages 60–65 Ages 60–65 to ages 65–70
Years
Mean Min Max Mean Min Max Mean Min Max
1990 4.9 0.6 10.9 17.9 0.0 75.7 37.3 15.4 67.4
1995 6.1 2.9 31.2 17.1 0.0 75.3 37.3 18.8 65.4
2000 5.5 1.2 12.2 16.2 0.2 77.9 40.5 21.5 70.5
2005 5.8 0.9 16.3 17.4 2.6 73.1 41.7 22.7 72.0
2010 4.9 0.2 11.5 16.8 5.1 67.9 42.0 24.8 66.9
Note: Data refer to 23 countries listed in Table 2
Source: International Labor Organization – ILOSTAT (2016 )
International Journal of Population Studies 2017, Volume 3, Issue 1 129