
Page 137 - IJPS-3-1
P. 137
Queiroz BL
force participation of older men were very slow. The large variation in male labor
force participation rates is better seen by income group. When countries were divided
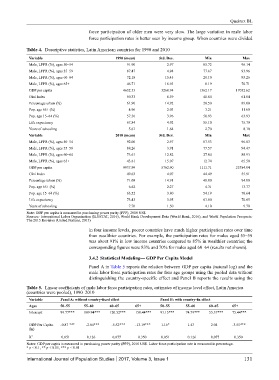
Table 4. Descriptive statistics, Latin American countries for 1990 and 2010
Variable 1990 (mean) Std. Dev. Min Max
Male, LFPR (%), ages 50–54 91.90 2.97 85.72 96.14
Male, LFPR (%), ages 55–59 87.47 4.94 77.67 93.96
Male, LFPR (%), ages 60–64 72.18 15.45 20.10 93.26
Male, LFPR (%), ages 65+ 46.71 16.93 8.19 70.71
GDP per capita 4632.53 3260.94 1362.17 17052.62
Gini Index 50.33 8.59 40.84 61.04
Percentage urban (%) 61.90 14.92 28.50 89.00
Pop. age 65+ (%) 4.96 2.03 3.21 11.60
Pop. age 15–64 (%) 57.56 3.96 50.93 63.93
Life expectancy 67.84 4.92 55.10 75.70
Years of schooling 5.61 1.64 2.70 8.10
Variable 2010 (mean) Std. Dev. Min Max
Male, LFPR (%), ages 50–54 92.00 2.97 87.53 96.83
Male, LFPR (%), ages 55–59 88.26 3.91 77.57 94.47
Male, LFPR (%), ages 60–64 73.61 12.82 27.04 88.93
Male, LFPR (%), ages 65+ 43.61 15.07 12.74 65.50
GDP per capita 9937.99 5762.90 1111.71 25384.04
Gini Index 49.63 4.07 44.49 55.91
Percentage urban (%) 71.08 14.91 48.80 94.00
Pop. age 65+ (%) 6.62 2.27 4.31 13.77
Pop. age 15–64 (%) 63.52 3.80 54.19 70.64
Life expectancy 73.43 3.95 61.80 70.65
Years of schooling 7.76 1.50 4.10 9.70
Note: GDP per capita is measured in purchasing power parity (PPP), 2010 US$.
Sources: International Labor Organization (ILOSTAT, 2016), World Bank Development Data (World Bank, 2016), and World Population Prospects:
The 2015 Revision (United Nations, 2015)
in four income levels, poorer countries have much higher participation rates over time
than wealthier countries. For example, the participation rates for males aged 55–59
was about 91% in low income countries compared to 85% in wealthier countries; the
corresponding figures were 83% and 70% for males aged 60–64 (results not shown).
3.4.2 Statistical Modeling— GDP Per Capita Model
Panel A in Table 5 reports the relation between GDP per capita (natural log) and the
male labor force participation rates for four age groups using the pooled data without
distinguishing the country-specific effect and Panel B reports the results using the
Table 5. Linear coefficients of male labor force participation rates, estimates of income level effect, Latin America
(countries were pooled), 1990–2010
Variable Panel A: without country-fixed effect Panel B: with country-fix effect
Ages 50–55 55–60 60–65 65+ 50–55 55–60 60–65 65+
Intercept 99.77*** 109.94*** 120.52*** 158.44*** 91.15*** 74.79*** 55.37*** 75.44***
GDP Per Capita -0.87 *** -2.64*** -5.52*** -13.19*** 1.16* 1.43 2.04 -3.55***
(ln)
2
R 0.051 0.126 0.077 0.350 0.051 0.126 0.077 0.350
Notes: GDP per capita is measured in purchasing power parity (PPP), 2010 US$. Labor force participation rate is measured in percentage.
* p < 0.1, ** p < 0.05, *** p < 0.01
International Journal of Population Studies 2017, Volume 3, Issue 1 131