
Page 139 - IJPS-3-1
P. 139
Queiroz BL
in the region. It is important to stress, however, that the impacts were much stronger
for the cross-countries variations (pooled data without country-fixed effect) than
for the within country variation over time. The relationships between economic
development, population aging, development of public pension programs, and labor
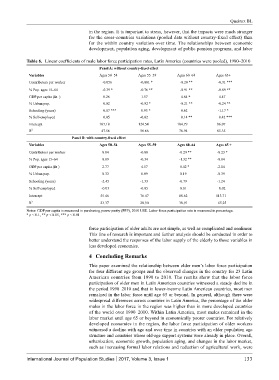
Table 6. Linear coefficients of male labor force participation rates, Latin America (countries were pooled), 1990–2010
Panel A: without country-fixed effect
Variables Ages 50–54 Ages 55–59 Ages 60–64 Ages 65+
Contributors per worker -0.056 -0.081 * -0.20 ** -0.31 ***
% Pop. ages 15–64 -0.39 * -0.76 ** -0.91 ** -0.89 **
GDP per capita (ln ) 0.26 1.57 4.64 * 4.47
% Urban pop. 0.02 -0.92 * -0.21 ** -0.24 **
Schooling (years) 0.87 *** 0.93 * 0.62 -1.17 *
% Self-employed 0.05 -0.02 0.14 ** 0.42 ***
Intercept 107.18 124.54 104.79 86.07
2
R 47.56 56.66 76.94 85.35
Panel B: with country-fixed effect
Variables Ages 50–54 Ages 55–59 Ages 60–64 Ages 65 +
Contributors per worker 0.04 -0.08 -0.29 ** -0.23 *
% Pop. ages 15–64 0.09 -0.34 -1.32 ** -0.04
GDP per capita (ln ) 2.77 4.57 8.42 * -2.14
% Urban pop. 0.33 0.09 0.19 -0.39
Schooling (years) -2.45 -1.33 -0.79 -1.24
% Self-employed -0.03 -0.05 0.01 0.02
Intercept 55.46 76.47 88.62 113.71
R 2 23.37 28.90 38.91 65.25
Notes: GDP per capita is measured in purchasing power parity (PPP), 2010 US$. Labor force participation rate is measured in percentage.
* p < 0.1, ** p < 0.05, *** p < 0.01
force participation of older adults are not simple, as well as complicated and nonlinear.
This line of research is important and further analysis should be conducted in order to
better understand the responses of the labor supply of the elderly to those variables in
less developed economies.
4 Concluding Remarks
This paper examined the relationship between older men’s labor force participation
for four different age groups and the observed changes in the country for 23 Latin
American countries from 1990 to 2010. The results show that the labor force
participation of older men in Latin American countries witnessed a steady decline in
the period 1990–2010 and that in lower-income Latin American countries, most men
remained in the labor force until age 65 or beyond. In general, although there were
widespread differences across countries in Latin America, the percentage of the older
males in the labor force in the region was higher than in more developed countries
of the world over 1990–2010. Within Latin America, most males remained in the
labor market until age 65 or beyond in economically poorer countries. For relatively
developed economies in the region, the labor force participation of older workers
witnessed a decline with age and over time in countries with an older population age
structure and countries where old-age support systems were already in place. Overall,
urbanization, economic growth, population aging, and changes in the labor market,
such as increasing formal labor relations and reduction of agricultural work, were
International Journal of Population Studies 2017, Volume 3, Issue 1 133