
Page 52 - IJPS-6-1
P. 52
Climate vulnerability and household nutrition in India
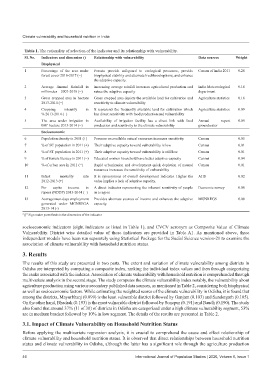
Table 1. The rationality of selection of the indicator and its relationship with vulnerability.
Sl. No. Indicators and dimension () Relationship with vulnerability Data sources Weight
Biophysical
1 Percentage of the area under Forests provide safeguard to ecological processes, provide Census of India 2011 0.28
forest cover 2016-2017 (−) biophysical stability and alternate livelihood options, and enhance
the adaptive capacity.
2 Average Annual Rainfall in Increasing average rainfall increases agricultural production and India Meteorological 0.18
millimeter – 2007-2016 (−) raises the adaptive capacity department
3 Gross cropped area in hectare Gross cropped area depicts the available land for cultivation and Agriculture statistics 0.16
2013-2014 (−) sensitivity to climate vulnerability
4 Cropping intensity in It represents the frequently available land for cultivation which Agriculture statistics 0.09
% 2013-2014 (−) has direct sensitivity with food production and vulnerability
5 The area under irrigation in Availability of irrigation facility has a direct link with food Annual report 0.09
000’ hectare 2013-2014 (−) production and sensitivity to the climate vulnerability groundwater
Socioeconomic
6 Population density in 2011 (+) Pressure on available natural resources increases sensitivity. Census 0.05
7 % of SC population in 2011 (+) Their adaptive capacity toward vulnerability is low Census 0.01
8 % of ST population in 2011 (+) Their adaptive capacity toward vulnerability is still\low Census 0.01
9 % of female literacy in 2011 (−) Educated women household have better adaptive capacity Census 0.04
10 % of urban area in 2011 (−) Rapid urbanization and development quick depletion of natural Census 0.01
resources increases the sensitivity of vulnerability
11 Infant mortality rate It is synonymous of overall development indicator. Higher the AHS 0.02
2012-2013 (+) value implies a lack of adaptive capacity.
12 Per capita income in A direct indicator representing the inherent sensitivity of people Economic survey 0.00
rupees (NDDP) 2013-2014 (−) in a region
13 Average man-days employment Provides alternate sources of income and enhances the adaptive MGNREGS 0.00
generated under MGNREGA capacity.
2013-14 (-)
“()” Sign under parenthesis is the dimension of the indicator
socioeconomic indicators (eight indicators as listed in Table 1), and CVCV acronym as Composite Value of Climate
Vulnerability. District wise detailed value of these indicators are provided in Table A1. As mentioned above, three
independent models have been run separately using Statistical Package for the Social Science version-21 to examine the
association of climate vulnerability with household nutrition status.
3. Results
The results of this study are presented in two parts. The extent and variation of climate vulnerability among districts in
Odisha are interpreted by computing a composite index, ranking the individual index values and then through categorizing
the ranks associated with the indexes. Association of climate vulnerability with household nutrition is comprehended through
multivariate analysis in the second stage. The study computes the climate vulnerability index notably, the vulnerability about
agriculture production using various secondary published data sources, as mentioned in Table 2, considering both biophysical
as well as socioeconomic factors. While estimating the weighted scores of the climate vulnerability in Odisha, it is found that
among the districts, Mayurbhanj (0.099) is the least vulnerable district followed by Ganjam (0.103) and Sundergarh (0.105).
On the other hand, Bhadrak (0.193) is the most vulnerable district followed by Sonepur (0.191) and Baudh (0.190). The study
also found that around 37% (11 of 30) of districts in Odisha are categorized under a high climate vulnerability segment, 53%
are in medium bracket followed by 10% in low segment. The details of the results are presented in Table 2.
3.1. Impact of Climate Vulnerability on Household Nutrition Status
Before applying the multivariate regression analysis, it is crucial to comprehend the cause and effect relationship of
climate vulnerability and household nutrition status. It is observed that direct relationships between household nutrition
status and climate vulnerability in Odisha, although the latter has a significant role through the agriculture production
46 International Journal of Population Studies | 2020, Volume 6, Issue 1