
Page 55 - IJPS-6-1
P. 55
Acharya and Das
17 1
0.957**
16 1
15 1 0.882** 0.850**
14 0.754** 0.273 0.280
1
13 0.688** −0.056 −0.013 0.085
1
12 0.037 0.712** 0.031 0.099 0.068
1
11 0.711** 0.540** 0.012 0.010
1 −0.055 −0.124
10 0.029 −0.389* 0.427 0.613** 0.497** 0.478**
1 −0.054
−0.640** 0.281 0.265
9 0.490**
1 −0.314 −0.121 −0.032 −0.038
8 0.196 0.201 0.084 0.018 0.510**
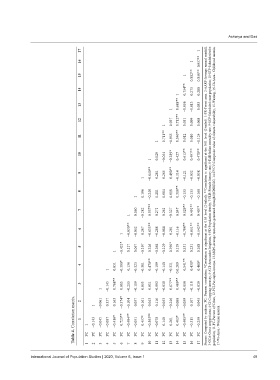
1 −0.240 −0.155 −0.135 −0.168 Source: Computed by authors; PC: Pearson correlation; *Correlation is significant at the 0.05 level (2-tailed); **Correlation is significant at the 0.01 level (2-tailed). 1-FR-Forest area, 2-AARF-Average annual rainfall, 3-GCA-Gross cropped area, 4-CI-Cropping intensity, 5-AUI-Area under Irrigation, 6-PD-Population density, 7-FLR-Female literacy rate, 8-IMR-Infant mortali
7 0.060 0.557** 0.271 0.261 0.047 0.529** 0.491** 0.407*
1 −0.282 −0.327
−0.630** 0.267 −0.633** 0.201 −0.704** −0.651** −0.542**
6
1 −0.052 −0.288 −0.084 −0.116
−0.421* 0.117 0.067 −0.197 0.326 −0.064 −0.129 0.119 0.331 0.231 0.268
5 0.390*
1
4 0.051 −0.390* 0.136 0.470** 0.541** 0.438* 0.460*
1 −0.323 −0.301 −0.199 −0.140 −0.331 0.0.209
−0.145 0.003 −0.255 −0.109 0.053 0.031 −0.093 −0.018 −0.056 −0.118 −0.019
3 0.768** 0.677** 0.489**
1 −0.061 0.357 0.163 −0.374* −0.104 0.037 −0.161 0.043 0.116 −0.053 −0.246 −0.080 −0.039 0.107 0.045
Table 4. Correlation matrix. 1 1 PC 1 −0.143 PC −0.045 PC −0.087 PC −0.416* PC 0.725** PC −0.484** PC −0.051 PC 0.457* PC −0.565** PC −0.078 PC 0.140 PC 0.261 PC 0.403* PC −0.495** PC −0.315 PC −0.259 PC 17-Wo Anea.- Women anemia
2
3
4
1
2
7
8
5
6
International Journal of Population Studies | 2020, Volume 6, Issue 1 9 10 11 12 13 14 15 16 17 49