
Page 56 - IJPS-6-1
P. 56
Climate vulnerability and household nutrition in India
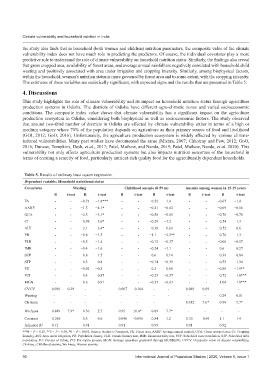
the study also finds that in household (both women and children) nutrition parameters, the composite value of the climate
vulnerability index does not have much role in predicting the predictors. Of course, the individual covariates play a more
predictive role to understand the role of climate vulnerability on household nutrition status. Similarly, the findings also reveal
that gross cropped area, availability of forest areas, and average annual rainfall are negatively correlated with household child
wasting and positively associated with area under irrigation and cropping intensity. Similarly, among biophysical factors,
within the household, women’s nutrition status is more governed by forest area and to some extent, with the cropping intensity.
The estimates of these variables are statistically significant, with expected signs and the results that are presented in Table 5.
4. Discussions
This study highlights the role of climate vulnerability and its impact on household nutrition status through agriculture
production systems in Odisha. The districts of Odisha have different agro-climatic zones and varied socioeconomic
conditions. The composite index value shows that climate vulnerability has a significant impact on the agriculture
production ecosystem in Odisha, considering both biophysical as well as socioeconomic factors. The study observed
that around two-third number of districts in Odisha are effected by climate vulnerability either in terms of a high or
medium category where 70% of the population depends on agriculture as their primary source of food and livelihood
(GOI, 2012; GoO, 2016). Unfortunately, the agriculture production ecosystem is widely affected by various climate-
induced vulnerabilities. Many past studies have documented the same (Mishra, 2007; Chhotray and Few, 2012; GoO,
2016; Duncan, Tompkins, Dash, et al., 2017; Patel, Mathew, and Nanda, 2019; Patel, Mathew, Nanda, et al. 2020). This
vulnerability not only affects agriculture production systems but also impacts nutrition outcomes of the household in
terms of creating a scarcity of food, particularly nutrient-rich quality food for the agriculturally dependent households.
Table 5. Results of ordinary least square regression.
Dependent variable: Household nutritional status
Covariates Wasting Childhood anemia (0‑59 m) Anemia among women in 15‑19 years
Β t‑test Β t‑test Β t‑test Β t‑test Β t‑test Β t‑test
FA - - −0.73 −1.8*** - - 0.52 1.4 - - −0.67 −1.4
AARF - - −1.5 −4.1* - - −0.21 −0.62 - - −0.09 −0.16
GCA - - −2.5 −3.1* - - −0.58 −0.81 - - −0.76 −0.78
CI - - 0.98 3.6* - - −0.29 −1.2 - - 0.54 1.3
AUI - - 2.1 3.4* - - 0.38 0.69 - - 0.52 0.6
PD - - −0.8 −1.5 - - −1.1 −2.2** - - 0.76 1.3
FLR - - −0.5 −1.4 - - −0.12 −0.37 - - −0.06 −0.17
IMR - - −0.4 −1.6 - - −0.24 −1.1 - - 0.6 0.27
SCP - - 0.8 1.7 - - 0.6 0.14 - - 0.39 0.84
STP - - 0.3 0.8 - - −0.14 −0.39 - - 0.53 1.34
PU - - −0.02 −0.3 - - 0.3 0.66 - - −0.86 −1.9**
PCI - - 0.4 0.87 - - −0.23 −0.57 - - 0.72 1.8***
MGN - - 0.6 0.91 - - −0.37 −0.67 - - 1.04 1.8***
CVCV 0.036 0.29 - - 0.007 0.104 - - 0.049 0.69 - -
Wasting - - - - - - - - - - −0.24 −0.81
Ch Anea - - - - - - - 0.912 7.6* 0.99 5.7*
Wo Anea 0.849 7.9* 0.36 2.7 0.95 16.4* 0.89 7.7* - - - -
Constant −0.265 0.5 0.6 −0.046 -0.096 0.84 1.2 −0.35 −0.69 −1.1 −1.4
Adjusted R 2 0.71 0.91 0.91 0.93 0.91 0.92
***0 < P < 0.10, **0 < P < 0.05, *0 < P < 0.001. Source: Author’s Computed; FR: Forest area, AARF: Average annual rainfall, GCA: Gross cropped area, CI: Cropping
intensity, AUI: Area under irrigation, PD: Population density, FLR: Female literacy rate, IMR: Infant mortality rate, SCP: Scheduled caste population, STP: Scheduled tribe
population, PU: Percent of Urban, PCI: Per-capita income, MGN: Average man-days generated through MGNRESG, CVCV: Composite value of climate vulnerability,
Ch Anea.: Childhood anemia, Wo Anea.: Women anemia
50 International Journal of Population Studies | 2020, Volume 6, Issue 1