
Page 54 - IJPS-6-1
P. 54
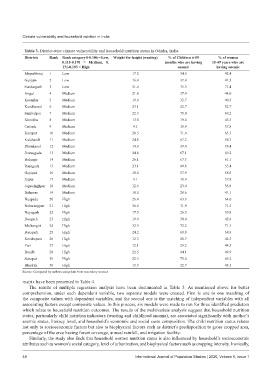
Climate vulnerability and household nutrition in India


           Table 3. District-wise climate vulnerability and household nutrition status in Odisha, India.
           Districts  Rank  Rank category 0‑0.106 = Low,  Weight‑for‑height (wasting)  % of Children 6‑59   % of women
                            0.115‑0.170  =  Medium,  0.                months who are having   15‑49 years who are
                            171‑0.193 = High                                 anemic          having anemic
           Mayurbhanj  1    Low                          17.2                 34.5               42.4
           Ganjam     2     Low                          16.4                 37.4               41.3
           Sundargarh  3    Low                          31.4                 75.3               71.4
           Angul      4     Medium                       21.6                 37.4               44.0
           Keonjhar   5     Medium                       19.0                 32.7               40.5
           Kandhamal  6     Medium                       23.1                 42.7               52.7
           Sambalpur  7     Medium                       22.3                 75.0               69.2
           Khordha    8     Medium                       13.8                 19.0               45.3
           Cuttack    9     Medium                        9.1                 18.9               37.8
           Koraput    10    Medium                       28.5                 71.4               63.3
           Kalahandi  11    Medium                       24.8                 67.2               68.7
           Dhenkanal  12    Medium                       19.0                 39.4               39.4
           Jharsuguda  13   Medium                       24.8                 67.1               69.2
           Bolangir   14    Medium                       26.1                 67.3               61.1
           Rayagada   15    Medium                       23.1                 49.8               55.4
           Gajapati   16    Medium                       18.4                 57.9               58.5
           Jajpur     17    Medium                        9.1                 18.9               37.8
           Jagatsinghpur  18  Medium                     12.6                 23.4               35.8
           Balasore   19    Medium                       18.0                 28.6               41.1
           Nuapada    20    High                         26.4                 63.9               64.0
           Nabarangpur  21  High                         36.0                 71.9               71.5
           Nayagarh   22    High                         17.5                 26.5               39.8
           Deogarh    23    High                         19.9                 30.0               42.6
           Malkangiri  24   High                         32.5                 72.2               71.3
           Baragarh   25    High                         24.2                 68.8               68.8
           Kendrapara  26   High                         12.3                 28.7               42.3
           Puri       27    High                         12.1                 29.2               44.3
           Boudh      28    High                         22.5                 44.1               49.9
           Sonepur    29    High                         22.3                 75.0               69.2
           Bhadrak    30    High                         15.3                 22.7               43.5
           Source: Computed by authors using data from secondary sources
           matrix have been presented in Table 4.
             The  results  of  multiple  regression  analysis  have  been  documented  in  Table  5.  As  mentioned  above  for  better
           comprehension,  under  each  dependent  variable,  two  separate  models  were  created.  First  is  one  to  one  matching  of
           the composite values with dependent variables, and the second one is the matching of independent variables with all
           associating factors except composite values. In this process, six models were made to run for three identified predictors
           which relate to household nutrition outcomes. The results of the multivariate analysis suggest that household nutrition
           status, particularly child nutrition indicators (wasting and childhood anemia), are associated significantly with mother’s
           anemic status, literacy level, and household’s economic and social caste composition. The child nutrition status relates
           not only to socioeconomic factors but also to biophysical factors such as district’s predisposition to gross cropped area,
           percentage of the area having forest coverage, annual rainfall, and irrigation facility.
             Similarly, the study also finds that household women nutrition status is also influenced by household’s socioeconomic
           attributes such as women’s social category, level of urbanization, and biophysical factors such as cropping intensity. Ironically,


           48                                              International Journal of Population Studies | 2020, Volume 6, Issue 1