
Page 76 - IJPS-6-1
P. 76
Disasters in Jammu and Kashmir, and Ladakh region
As a result of its geographical and climatic conditions, poor socio-economic profile, and numerous terrorisms-based
violence, India is afflicted by multiple disasters. Over a period of 20 years, from 1996 to 2015, natural disasters killed
97,691 people in India. This represents the fifth highest mortality rate in the world (UNIDSR and CRED, 2016). India
has also been affected by violent man-made disasters in the form of wars, insurgency, and terrorism. The Bhopal gas
tragedy in 1984 remains the country’s worst industrial disaster thus far. The recently bifurcated union territories (UTs)
of Jammu and Kashmir (J&K) and Ladakh (hence forth has been used as J&K and Ladakh region) in the northernmost
part of India, is one of the most severely affected regions by both natural (Table 1) and man-made disasters. It is a region
prone to multiple hazards on account of its topography and varying, extreme climate. The region has suffered massive
floods, devastating earthquakes, and recurrent avalanches and landslides (SDMP, 2017). The earthquake in 2005, flash
floods and landslides in 2010, and the massive floods of 2014 are among the major natural disasters the state has faced
over the past 15 years (Kumar, Martha, and Roy, 2006; Gupta, Khanna, and Majumdar, 2012; SDMP, 2017). The state has
also borne the brunt of disputes between India and Pakistan, witnessing regular cross-border infiltrations, state-sponsored
terrorism, and violent attacks. The displacement of communities from their homelands, long-drawn-out protests leading
to curfews, and regular clashes between terrorists and armed forces, have been some of the manifestations of the violence
(Shekhawat, 2009; Behera, 2016).
This combination of natural and man-made disasters has had adverse effects on key facets of J&K and Ladakh region’s
economy, including key sources of revenues such as agriculture, horticulture, handicrafts, and tourism (Sharma, Sharma,
and Waris, 2012). These disasters have stretched the administrative machinery of the region and left its population
vulnerable. However, there are lack of studies which have focused on the aftermath of specific natural disasters and
incidents of terrorism and violence as a form of disaster. There have been lack of studies which have explored the impact
of natural and man-made disasters on people’s lives and development in a comprehensive way. This article attempts to
review the impact of different natural and man-made disasters (e.g., terrorism and violence) on the people of J&K and
Ladakh region. It reviews the impact of disasters and the mechanisms of resilience adopted by the people of the region,
and identify measures taken by the government in response to these disasters.
1.1. Geography and Weather
As per the recently formed UTs of J&K (as of October 31, 2019), UTs of J&K has 20 districts and UTs of Ladakh has two
districts, both combined covering the geographical area of 222,236 km (Census of India, 2011). The climatic conditions
2
vary from tropical heat in Jammu, to temperate conditions of the Kashmir valley, to the arctic cold of Ladakh. There
is large variation in temperature from the average maximum of 33°C (Jammu) in summers to the average minimum
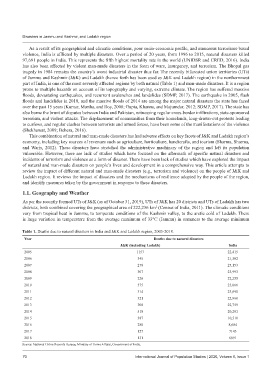
Table 1. Deaths due to natural disasters in India and J&K and Ladakh region, 2005-2018.
Year Deaths due to natural disasters
J&K (including Ladakh) India
2005 1157 22,415
2006 345 21,502
2007 278 25,153
2008 307 23,993
2009 226 22,255
2010 575 25,066
2011 314 23,690
2012 321 22,960
2013 308 22,759
2014 518 20,201
2015 387 10,510
2016 280 8,684
2017 127 7143
2018 131 6891
Source: National Crime Records Bureau, Ministry of Home Affairs, Government of India.
70 International Journal of Population Studies | 2020, Volume 6, Issue 1