Page 13 - IJPS-7-1
P. 13

Chauhan, et al.


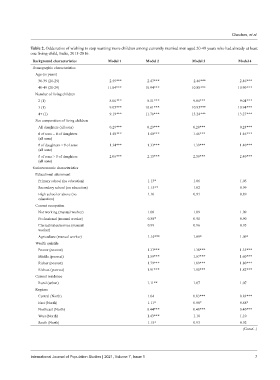
              Table 2. Odds ratios of wishing to stop wanting more children among currently married men aged 20-49 years who had already at least
              one living child, India, 2015-2016.

               Background characteristics      Model 1         Model 2             Model 3            Model 4
               Demographic characteristics
                Age (in years)
                 30-39 (20-29)                   2.55***         2.47***             2.46***            2.46***
                 40-49 (20-29)                 11.04***        10.94***            10.88***           10.90***
                Number of living children
                 2 (1)                           8.06***         8.51***            9.04***             9.04***
                 3 (1)                           9.05***       10.61***            10.95***           10.94***
                 4+ (1)                          9.19***       11.76***            13.24***           13.27***
                Sex composition of living children
                 All daughters (all sons)        0.29***         0.29***            0.28***             0.28***
                 # of sons = # of daughters      1.40***         1.40***            1.46***             1.46***
                 (all sons)
                 # of daughters > # of sons      1.34***         1.33***            1.39***             1.40***
                 (all sons)
                 # of sons > # of daughters      2.06***         2.13***            2.39***             2.40***
                 (all sons)
               Socioeconomic characteristics
                Educational attainment
                 Primary school (no education)                     1.13*               1.06                1.05
                 Secondary school (no education)                   1.15**              1.02                0.99
                 High school or above (no                          1.10                0.91                0.89
                 education)
                Current occupation
                 Not working (manual worker)                       1.08                1.09                1.09
                 Professional (manual worker)                      0.88*               0.90                0.90
                 Clerical/sales/service (manual                    0.99                0.96                0.95
                 worker)
                 Agriculture (manual worker)                       1.14***             1.09*               1.09*
                Wealth quintile
                 Poorer (poorest)                                1.33***            1.38***             1.35***
                 Middle (poorest)                                1.59***            1.67***             1.60***
                 Richer (poorest)                                1.79***            1.89***             1.80***
                 Richest (poorest)                               1.91***            1.90***             1.82***
                Current residence
                 Rural (urban)                                  1.11**                 1.07                1.07
                Regions
                 Central (North)                                   1.04             0.83***             0.83***
                 East (North)                                      1.11*               0.88*               0.88*
                 Northeast (North)                               0.44***            0.40***             0.40***
                 West (North)                                    1.43***               1.10                1.10
                 South (North)                                     1.15*               0.93                0.92
                                                                                                        (Contd...)


              International Journal of Population Studies | 2021, Volume 7, Issue 1                           7
   8   9   10   11   12   13   14   15   16   17   18