
Page 14 - IJPS-7-1
P. 14
Fertility limiting intention and contraceptive use among Indian men
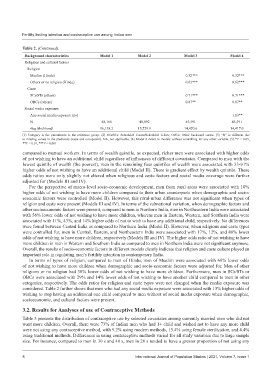
Table 2. (Continued).
Background characteristics Model 1 Model 2 Model 3 Model 4
Religious and cultural factors
Religion
Muslim (Hindu) 0.32*** 0.32***
Others or no religion (Hindu) 0.62*** 0.62***
Caste
SCs/STs (others) 0.71*** 0.71***
OBCs (others) 0.87** 0.87**
Social media exposure
Any social media exposure (no) 1.13**
N 48,166 48,092 45,591 45,591
-log likelihood 16,138.2 15,729.9 14,420.6 14,417.0
(1) Category is the parentheses is the reference group. (2) SCs/STs: Scheduled Castes/Scheduled Tribes; OBCs: Other backward castes. (3) “N” is different due
to missing values in the predictors (caste and occupation). NA, not applicable. (4) Model 0 refers to models without controlling for any other variable. (5) *P < 0.05,
**P < 0.01, ***P < 0.001
compared to manual workers. In terms of wealth quintile, as expected, richer men were associated with higher odds
of not wishing to have an additional child regardless of influences of different covariates. Compared to men with the
lowest quintile of wealth (the poorest), men in the remaining four quintiles of wealth were associated with 33-91%
higher odds of not wishing to have an additional child (Model II). There is gradient effect by wealth quintile. These
odds ratios were only slightly not altered when religious and caste factors and social media coverage were further
adjusted for (Models III and IV).
For the perspective of macro-level socio-economic development, men from rural areas were associated with 10%
higher odds of not wishing to have more children compared to their urban counterparts when demographic and socio-
economic factors were controlled (Model II). However, this rural-urban difference was not significant when types of
religion and caste were present (Models III and IV). In terms of the subnational variation, when demographic factors and
other socioeconomic factors were present, compared to men in Northern India, men in Northeastern India were associated
with 56% lower odds of not wishing to have more children, whereas men in Eastern, Western, and Southern India were
associated with 11%, 43%, and 14% higher odds of not to wish to have any additional child, respectively. No differences
were found between Central India as compared to Northern India (Model II). However, when religious and caste types
were controlled for, men in Central, Eastern, and Northeastern India were associated with 17%, 12%, and 40% lower
odds of not wishing to have more children, respectively (Models III and IV). The higher odds ratio of not wishing to have
more children in men in Western and Southern India as compared to men in Northern India were not significant anymore.
Overall, the results of socio-economic factors in different models clearly indicate that religion and caste culture played an
important role in regulating men’s fertility intention in contemporary India.
In terms of types of religion, compared to men of Hindu, men of Muslim were associated with 68% lower odds
of not wishing to have more children when demographic and socio-economic factors were adjusted for. Men of other
religions or no religion had 38% lower odds of not wishing to have more children. Furthermore, men in SCs/STs or
OBCs were associated with 29% and 14% lower odds of not wishing to have another child compared to men in other
categories, respectively. The odds ratios for religion and caste types were not changed when the media exposure was
considered. Table 2 further shows that men who had any social media exposure were associated with 13% higher odds of
wishing to stop having an additional one child compared to men without of social media exposure when demographic,
socioeconomic, and cultural factors were present.
3.2. Results for Analyses of use of Contraceptive Methods
Table 3 presents the distribution of contraceptive use by selected covariates among currently married men who did not
want more children. Overall, there were 73% of Indian men who had 1+ child and wished not to have any more child
were not using any contraceptive method, with 9.2% using modern methods, 13.4% using female sterilization, and 4.4%
using traditional methods. Differences in using contraceptive methods varied for all study variables due to large sample
size. For instance, compared to men in 30 s and 40 s, men in 20 s tended to have a greater proportion of not using any
8 International Journal of Population Studies | 2021, Volume 7, Issue 1