
Page 27 - IJPS-7-1
P. 27
Chauhan, et al.
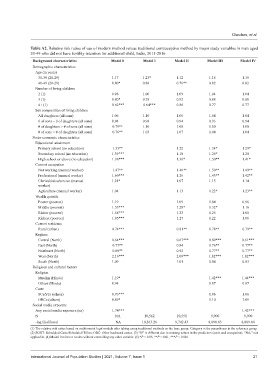
Table A2. Relative risk ratios of use of modern method versus traditional contraceptive method by major study variables in men aged
20-49 who did not have fertility intention for additional child, India, 2015-2016.
Background characteristics Model 0 Model I Model II Model III Model IV
Demographic characteristics
Age (in years)
30-39 (20-29) 1.17 1.23* 1.12 1.18 1.19
40-49 (20-29) 0.80* 0.88 0.76** 0.82 0.82
Number of living children
2 (1) 0.98 1.00 1.09 1.04 1.04
3 (1) 0.80* 0.78 0.92 0.88 0.88
4+ (1) 0.62*** 0.64*** 0.86 0.77 0.77
Sex composition of living children
All daughters (all sons) 1.06 1.10 1.06 1.04 1.04
# of sons = # of daughters (all sons) 0.94 0.98 0.94 0.93 0.94
# of daughters > # of sons (all sons) 0.79** 1.10 1.08 1.00 1.00
# of sons > # of daughters (all sons) 0.76** 1.03 1.07 1.04 1.04
Socio-economic characteristics
Educational attainment
Primary school (no education) 1.33** 1.22 1.34* 1.29*
Secondary school (no education) 1.39*** 1.10 1.28* 1.20
High school or above (no education) 1.96*** 1.36* 1.50** 1.41*
Current occupation
Not working (manual worker) 1.47** 1.46** 1.50** 1.49**
Professional (manual worker) 1.60*** 1.26 1.43** 1.42**
Clerical/sales/service (manual 1.21* 1.07 1.15 1.14
worker)
Agriculture (manual worker) 1.04 1.13 1.22* 1.23**
Wealth quintile
Poorer (poorest) 1.19 1.09 1.04 0.96
Middle (poorest) 1.53*** 1.28* 1.32* 1.16
Richer (poorest) 1.58*** 1.23 1.25 1.08
Richest (poorest) 1.85*** 1.27 1.22 1.06
Current residence
Rural (urban) 0.74*** 0.81** 0.78** 0.79**
Regions
Central (North) 0.64*** 0.67*** 0.60*** 0.61***
East (North) 0.77** 0.84 0.76** 0.77**
Northeast (North) 0.80** 0.92 0.77** 0.77**
West (North) 2.16*** 2.09*** 1.82*** 1.82***
South (North) 1.09 1.01 0.84 0.83
Religious and cultural factors
Religion
Muslim (Hindu) 1.19* 1.42*** 1.44***
Others (Hindu) 0.94 0.87 0.87
Caste
SCs/STs (others) 0.76*** 1.06 1.06
OBCs (others) 0.89* 1.10 1.09
Social media exposure
Any social media exposure (no) 1.74*** 1.42***
N NA 10,562 10,551 9,900 9,900
-log likelihood NA 10,563.26 9,742.43 8,898.83 8,889.04
(1) The relative risk ratios based on multinomial logit models after taking using traditional methods as the base group. Category is the parentheses is the reference group.
(2) SC/ST: Scheduled Caste/Scheduled Tribes; OBC: Other backward castes. (3) “N” is different due to missing values in the predictors (caste and occupation). “NA,” not
applicable. (4) Model 0 refers to results without controlling any other variable. (5) *P < 0.05, **P < 0.01, ***P < 0.001
International Journal of Population Studies | 2021, Volume 7, Issue 1 21