
Page 11 - IJPS-9-1
P. 11
International Journal of
Population Studies Local population changes as a spatial varying multiscale process
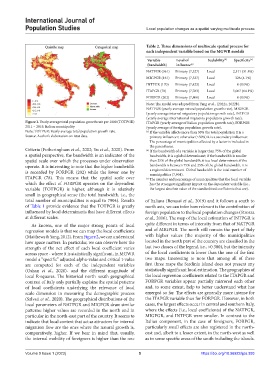
Table 2. Three dimensions of multiscale spatial process for
each independent variable based on the MGWR models
Variable Level of Scalability (b) Specificity (c)
(bandwidth) influence (a)
NATPGR (361) Primary (7,527) Local 2,511 (31.8%)
MIGPGR (161) Primary (7,527) Local 326 (4.1%)
INTPGR (170) Primary (7,423) Local 0 (0.0%)
ITAPGR (78) Primary (7,783) Local 5,067 (64.1%)
FORPGR (202) Primary (7,800) Local 0 (0.0%)
Note: The model was adapted from Yang et al., (2022a, 2022b).
NATPGR (yearly average natural population growth rate), MIGPGR
(yearly average internal migratory population growth rate), INTPGR
(yearly average international migratory population growth rate),
Figure 1. Yearly average total population growth rate per 1000 (TOTPGR) ITAPGR (yearly average of Italian population growth rate), FORPGR
2011 – 2019, Italian municipality (yearly average of foreign population growth rate).
Note: TOTPGR: Yearly average total population growth rate. (a) If the variable affects more than 50% the total population it is a
Source: Author’s elaboration on Istat data. primary influencer; otherwise (≤50%) it is a secondary influencer.
The percentage of municipalities affected by a factor is included in
the parentheses.
Criteria (Fotheringham et al., 2002; Yu et al., 2020). From (b) If the bandwidth of a variable is larger than 75% of the global
a spatial perspective, the bandwidth is an indicator of the bandwidth, it is a global determinant; if the bandwidth is smaller
spatial scale over which the processes under observation than 25% of the global bandwidth, it is a local determinant; if the
operate. It is interesting to note that the higher bandwidth bandwidth is between 75% and 25% of the global bandwidth, it is
is recorded by FORPGR (202) while the lower one by a regional determinant. Global bandwidth is the total number of
municipalities (7,904).
ITAPGR (78). This means that the spatial scale over (c) The number and percentage of municipalities that the focal variable
which the effect of FORPGR operates on the dependent has the strongest significant impact on the dependent variable (i.e.,
variable (TOTPGR) is higher, although it is relatively the largest absolute value of the standardized coefficients that are).
small in geographical sense (the total bandwidth, i.e., the
total number of municipalities is equal to 7904). Results of Italians (Benassi et al., 2019) and it follows a south to
of Table 1 provide evidence that the TOTPGR is greatly north axis, we can infer how relevant is the contribution of
influenced by local determinants that have different effects foreign population to the local population changes (Strozza
at different scales. et al., 2016). The map of the local estimation of INTPGR is
As known, one of the major strong points of local quite different in terms of intensity from that of NATPGR
regression models is that we can map the local coefficients and of MIGPGR. The north still remain the part of Italy
(Matthews & Yang, 2012). From Figure 2, we can understand with higher values (the majority of the municipalities
how space matters. In particular, we can observe how the located in the north part of the country are classified in the
strength of the net effect of each local coefficient varies last two classes of the legend, i.e., >0.300), but the intensity
across space - where it is statistically significant, in MGWR of the local coefficients is lower than the one of the first
model a “specific” adjusted alpha-value and critical t-value two maps. Interesting to note that among all of these
are computed for each of the independent variables first three maps the Sardinia Island does not present any
(Oshan et al., 2020)- and the different magnitude of statistically significant local estimation. The geographies of
local R-squares. The historical north–south geographical the local regression coefficients related to the ITAPGR and
contrast of Italy only partially explains the spatial patterns FORPGR variables appear partially mirrored each other
of local coefficients underlying the relevance of local and, to some extent, help to better understand what has
scale dimension in measuring the demographic process emerged so far. The effects are generally more intense for
(Salvati et al., 2020). The geographical distributions of the the ITAPGR variable than for FORPGR. However, in both
local parameters of NATPGR and MIGPGR draw similar cases, the largest effects occur in central and southern Italy,
patterns: higher values are recorded in the north and in where the effects (i.e., local coefficients) of the NATPGR,
particular in the north-east part of the country. It seems to MIGPGR, and INTPGR were smaller. In contrast to the
indicate that local context that act as attractors for internal Italian component, in the case of foreigners, FORPGR,
migration flow are the ones where the natural growth is, particularly small effects are also registered in the north-
comparatively, higher. If we bear in mind that, usually, east and, albeit to a lesser extent, in the north-west as well
the internal mobility of foreigners is higher than the one as in some specific areas of the south including the islands.
Volume 9 Issue 1 (2023) 5 https://doi.org/10.36922/ijps.393