Page 46 - IJPS-9-1
P. 46

International Journal of
            Population Studies                                                  Transportation assimilation in Hong Kong


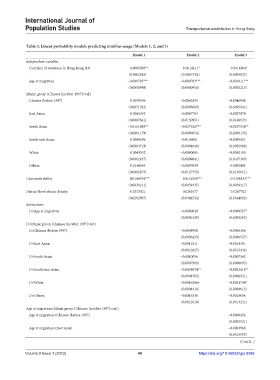
            Table 3. Linear probability models predicting minibus usage (Models 1, 2, and 3)
                                                         Model 1                Model 2              Model 3
            Independent variables
             Duration of residence in Hong Kong (D)       0.0008380**            0.0014111*          0.0014904*
                                                         (0.0002915)           (0.0005781)         (0.0005837)
             Age at migration                          −0.000783***           −0.000763***        −0.001011***
                                                        (0.0000949)            (0.0000956)         (0.0002215)
            Ethnic group (Chinese [in/after 1997]=ref.)
             Chinese [before 1997]                        0.0070596           −0.0062835          −0.0046948
                                                        (0.0071382)            (0.0095889)         (0.0095941)
             East Asian                                   0.0065193           −0.0067763          −0.0027870
                                                        (0.0087641)            (0.0150991)         (0.0168933)
             South Asian                               −0.0161889**           −0.0273267**        −0.0257558**
                                                        (0.0061179)            (0.0090054)         (0.0090158)
             South-east Asian                             0.0089186           −0.0106081          −0.0095421
                                                        (0.0063719)            (0.0091648)         (0.0092006)
             White                                        0.0069552           −0.0090005          −0.0050199
                                                        (0.0062437)            (0.0099641)         (0.0107389)
             Others                                       0.0146943           −0.0007639             0.0035438
                                                        (0.0092873)            (0.0127758)         (0.0130051)
            Cantonese ability                             0.0146034***           0.0151558***        0.0154833***
                                                        (0.0039161)            (0.0039335)         (0.0039317)
            District-level ethnic density                 0.0373921              0.0263577           0.0267702
                                                        (0.0262907)            (0.0344524)         (0.0344692)
            Interactions
             D×Age at migration                                               −0.0000049          −0.0000587*
                                                                               (0.0000128)         (0.0000263)
            D×Ethnic group (Chinese [in/after 1997]=ref.)
             D×Chinese (before 1997)                                          −0.0004988          −0.0006306
                                                                               (0.0006439)         (0.0006527)
             D×East Asian                                                     −0.0011811          −0.0014381
                                                                               (0.0012627)         (0.0015434)
             D×South Asian                                                    −0.0010096          −0.0007562
                                                                               (0.0007988)         (0.0008095)
             D×South-east Asian                                               −0.0024034**        −0.0023418**
                                                                               (0.0008703)         (0.0008921)
             D×White                                                          −0.0016206+         −0.0021740*
                                                                               (0.0008318)         (0.0009613)
             D×Others                                                         −0.0016336          −0.0019054
                                                                               (0.0012010)         (0.0013231)
            Age at migration×Ethnic group (Chinese [in/after 1997]=ref.)
             Age at migration×Chinese (before 1997)                                               −0.0000454
                                                                                                   (0.0002521)
             Age at migration×East Asian                                                          −0.0003968
                                                                                                   (0.0015593)
                                                                                                       (Cont’d...)

            Volume 9 Issue 1 (2023)                         40                        https://doi.org/10.36922/ijps.0386
   41   42   43   44   45   46   47   48   49   50   51