
Page 49 - IJPS-9-1
P. 49
International Journal of
Population Studies Transportation assimilation in Hong Kong
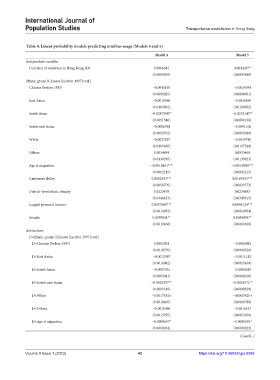
Table 4. Linear probability models predicting minibus usage (Models 4 and 5)
Model 4 Model 5
Independent variables
Duration of residence in Hong Kong (D) 0.0006615 0.0014437*
(0.0008938) (0.0005840)
Ethnic group (Chinese [in/after 1997]=ref.)
Chinese (before 1997) −0.0045155 −0.0039954
(0.0096029) (0.0096001)
East Asian −0.0018566 −0.0025499
(0.0169862) (0.0168902)
South Asian −0.0247590** −0.0253147**
(0.0091346) (0.0090198)
South-east Asian −0.0086768 −0.0091106
(0.0092362) (0.0092040)
White −0.0027827 −0.0039780
(0.0109656) (0.0107540)
Others 0.0034494 0.0033468
(0.0130295) (0.0130023)
Age at migration −0.0010161*** −0.0010099***
(0.0002219) (0.0002215)
Cantonese ability 0.0182503*** 0.0167433***
(0.0050770) (0.0039773)
District-level ethnic density 0.0223478 0.0234693
(0.0346453) (0.0345013)
Logged personal income 0.0057689*** 0.0058124***
(0.0014993) (0.0014994)
Female 0.0059081** 0.0059894**
(0.0019468) (0.0019490)
Interactions
D×Ethnic group (Chinese [in/after 1997]=ref.)
D×Chinese [before 1997] 0.0002024 −0.0006082
(0.0010370) (0.0006528)
D×East Asian −0.0012567 −0.0011182
(0.0016082) (0.0015490)
D×South Asian −0.0007201 −0.0006285
(0.0009013) (0.0008106)
D×South-east Asian −0.0025297** −0.0024571**
(0.0009189) (0.0008929)
D×White −0.0017552+ −0.0017425+
(0.0010605) (0.0009789)
D×Others −0.0018360 −0.0016327
(0.0013795) (0.0013300)
D×Age at migration −0.0000607* −0.0000591*
(0.0000264) (0.0000263)
(Cont’d...)
Volume 9 Issue 1 (2023) 43 https://doi.org/10.36922/ijps.0386