Page 47 - IJPS-9-1
P. 47

International Journal of
            Population Studies                                                  Transportation assimilation in Hong Kong


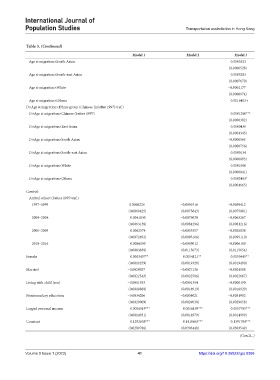
            Table 3. (Continued)
                                                         Model 1                Model 2              Model 3
             Age at migration×South Asian                                                            0.0005523
                                                                                                   (0.0006528)
             Age at migration×South-east Asian                                                       0.0005283
                                                                                                   (0.0007670)
             Age at migration×White                                                               −0.0002177
                                                                                                   (0.0008974)
             Age at migration×Others                                                                 0.0016403+
            D×Age at migration×Ethnic group (Chinese [in/after 1997]=ref.)
             D×Age at migration×Chinese (before 1997)                                                0.0001296***
                                                                                                   (0.0000392)
             D×Age at migration×East Asian                                                           0.0000430
                                                                                                   (0.0001343)
             D×Age at migration×South Asian                                                       −0.0000565
                                                                                                   (0.0000756)
             D×Age at migration×South-east Asian                                                     0.0000134
                                                                                                   (0.0000893)
             D×Age at migration×White                                                                0.0001056
                                                                                                   (0.0000841)
             D×Age at migration×Others                                                               0.0002493*
                                                                                                   (0.0001065)
            Controls
             Arrival cohort (before 1997=ref.)
               1997–1999                                 0.0066226            −0.0059316          −0.0059412
                                                        (0.0060425)            (0.0075843)         (0.0075801)
               2000–2004                                  0.0041830           −0.0073039          −0.0063267
                                                        (0.0063138)            (0.0081296)         (0.0081216)
               2005–2009                                  0.0062574           −0.0035357          −0.0026838
                                                        (0.0072692)            (0.0095166)         (0.0095110)
               2010–2016                                  0.0086150           −0.0005012          −0.0006189
                                                        (0.0083830)            (0.0115073)         (0.0115054)
            Female                                        0.0053457**            0.0054121**         0.0059645**
                                                        (0.0019259)            (0.0019328)         (0.0019490)
            Married                                    −0.0028037             −0.0027136          −0.0024588
                                                        (0.0022543)            (0.0022586)         (0.0022667)
            Living with child (ren)                    −0.0001933             −0.0001354          −0.0000190
                                                        (0.0018880)            (0.0018919)         (0.0018929)
            Postsecondary education                    −0.0034206             −0.0034021          −0.0031982
                                                        (0.0029009)            (0.0029030)         (0.0029058)
            Logged personal income                        0.0056519***           0.0056139***        0.0057795***
                                                        (0.0014931)            (0.0014979)         (0.0014999)
            Constant                                      0.1292658***           0.1418663***        0.1391784***
                                                        (0.0299786)            (0.0303448)         (0.0303549)
                                                                                                       (Cont’d...)


            Volume 9 Issue 1 (2023)                         41                        https://doi.org/10.36922/ijps.0386
   42   43   44   45   46   47   48   49   50   51   52