
Page 50 - IJPS-9-1
P. 50
International Journal of
Population Studies Transportation assimilation in Hong Kong
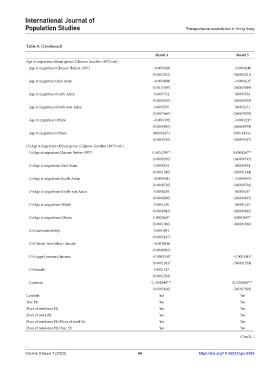
Table 4. (Continued)
Model 4 Model 5
Age at migration×Ethnic group (Chinese [in/after 1997]=ref.)
Age at migration×Chinese [before 1997] −0.0000420 −0.0000446
(0.0002522) (0.0002521)
Age at migration×East Asian −0.0004080 −0.0004135
(0.0015599) (0.0015589)
Age at migration×South Asian 0.0005724 0.0005558
(0.0006529) (0.0006529)
Age at migration×South-east Asian 0.0005205 0.0005151
(0.0007669) (0.0007670)
Age at migration×White −0.0001992 −0.0002217
(0.0008985) (0.0008979)
Age at migration×Others 0.0016247+ 0.0016124+
(0.0009185) (0.0009187)
D×Age at migration×Ethnic group (Chinese [in/after 1997]=ref.)
D×Age at migration×Chinese [before 1997] 0.0001298** 0.0001267**
(0.0000395) (0.0000393)
D×Age at migration×East Asian 0.0000532 0.0000494
(0.0001345) (0.0001344)
D×Age at migration×South Asian −0.0000441 −0.0000472
(0.0000758) (0.0000758)
D×Age at migration×South-east Asian 0.0000238 0.0000187
(0.0000896) (0.0000895)
D×Age at migration×White 0.0001196 0.0001163
(0.0000843) (0.0000842)
D×Age at migration×Others 0.0002663* 0.0002607*
(0.0001066) (0.0001066)
D×Cantonese ability 0.0003051
(0.0005417)
D×District-level ethnic density −0.0039186
(0.0040039)
D×Logged personal income −0.0003245* −0.0003419*
(0.0001613) (0.0001534)
D×Female 0.0001317
(0.0002784)
Constant 0.1362044*** 0.1320566***
(0.0305408) (0.0307300)
Controls Yes Yes
Year FE Yes Yes
Place of residence FE Yes Yes
Place of work FE Yes Yes
Place of residence FE×Place of work FE Yes Yes
Place of residence FE×Year FE Yes Yes
(Cont’d...)
Volume 9 Issue 1 (2023) 44 https://doi.org/10.36922/ijps.0386