
Page 78 - IJPS-9-1
P. 78
International Journal of
Population Studies COVID-19, economic crisis, insomnia, and stress
®
to IBM SPSS version 23.0 for analysis. Following the the relationship, the absence of multicollinearity, and the
practice in other populations in the literature (e.g., Huang homoscedasticity assumptions. The beta coefficient, its 95%
& Zhao, 2020), the database was weighted to match the confidence interval, and p-value were reported in all models.
population distribution according to gender, age, and
dwelling region based on the Central Administration of 3. Results
Statistics, Lebanon. In the descriptive analysis, frequency 3.1. Sociodemographic characteristics, PTSS, and
and percentage were used for categorical variables, while insomnia
mean and standard deviations were used for quantitative
variables. For the dependent variables (PCL-5 for PTSS and In this sample of the general Lebanese population, the mean
LIS-18 for insomnia), the median and interquartile regions PCL-5 score was 17.64 (standard deviation [SD] = 17.0)
were presented as well; the distribution of these variables (median = 13, IQR = 3 – 28), while the mean LIS-18 score
was considered normal using visual inspection of the was 44.61 (SD = 11.24) (median = 44, IQR = 35 – 53]. The
histogram, while the skewness and kurtosis were lower than prevalence of PTSS was 21.68% (n = 109; 95% CI [18.07%;
1. These conditions are deemed compatible with normality 25.30%]), and that of insomnia 11.48% (n = 58; 95% CI
[8.58%; 14.25%]).
in a sample size higher than 300 (Mishra et al., 2019).
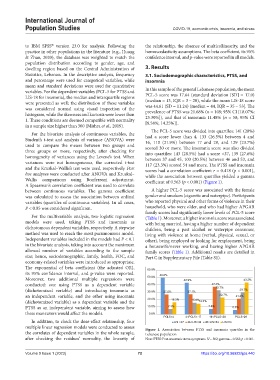
The PCL-5 score was divided into quartiles: 141 (28%)
For the bivariate analysis of continuous variables, the
Student’s t-test and analysis of variance (ANOVA) were had a score lower than 4, 133 (26.5%) between 4 and
16, 110 (21.9%) between 17 and 29, and 129 (23.7%)
used to compare the means between two groups and scored 30 or more. The insomnia score was also divided
three groups or more, respectively, after checking for into quartiles: 143 (28.5%) had a score <37, 139 (27.6%)
homogeneity of variances using the Levene’s test. When between 37 and 45, 103 (20.5%) between 46 and 53, and
variances were not homogeneous, the corrected t-test 117 (23.3%) scored 54 and more. The PTSS and insomnia
and the Kruskal–Wallis’s test were used, respectively. Post scores had a correlation coefficient r = 0.418 (p < 0.001),
hoc analyses were conducted after ANOVA and Kruskal– while the association between quartiles yielded a gamma
Wallis comparisons using Bonferroni adjustment. coefficient of 0.563 (p < 0.001) (Figure 1).
A Spearman’s correlation coefficient was used to correlate
between continuous variables. The gamma coefficient A higher PCL-5 score was associated with the female
was calculated to assess the association between ordinal gender and smokers (cigarette and waterpipe). Participants
variables (quartiles of continuous variables). In all cases, who reported physical and other forms of violence in their
P < 0.05 was considered significant. household, who were older, and who had higher APGAR
family scores had significantly lower levels of PCL-5 score
For the multivariable analysis, two logistic regression (Table 1). Moreover, a higher insomnia score was associated
models were used, taking PTSS and insomnia as with being married, having a higher number of dependent
dichotomous dependent variables, respectively. A stepwise children, being a past alcohol or waterpipe consumer,
method was used to reach the most parsimonious model. living with violence at home (verbal, physical, sexual, or
Independent variables included in the models had P < 0.1 other), being employed or looking for employment, being
in the bivariate analysis, taking into account the maximum a housewife/never working, and having higher APGAR
allowed number of variables according to the sample family scores (Table 1). Additional results are detailed in
size; hence, sociodemographic, family, health, FOC, and Part C in Supplementary File (Table S1).
economy-related variables were introduced as appropriate.
The exponential of beta coefficient (the adjusted OR), 60.0%
its 95% confidence interval, and p-value were reported. 49.6%
Moreover, two additional multiple regressions were 50.0% 42.9% 43.2%
conducted: one using PTSS as a dependent variable 40.0% 37.3%
32.7%
(dichotomized variable) and introducing insomnia as 30.0% 27.0% 27.1% 29.7%
an independent variable, and the other using insomnia 20.0% 22.7% 21.2%
(dichotomized variable) as a dependent variable and the 16.3% 15.8% 14.3%
PTSS as an independent variable, aiming to assess how 10.0% 7.1% 7.3% 5.9%
these maneuvers would affect the models. 0.0%
PCL5<4 4<PCL5< 17 16<PCL5<30 PCL5>29
In addition, to check the dose-effect relationship, four LIS <37 36<LIS<46 45<LIS<54 LIS>53
multiple linear regression models were conducted to assess Figure 1. Association between PTSS and insomnia quartiles in the
the correlates of dependent variables in the whole sample, Lebanese population
after checking the residues’ normality, the linearity of Note: PTSS: Post-traumatic stress symptoms. N = 502; gamma = 0.563; p < 0.001.
Volume 9 Issue 1 (2023) 72 https://doi.org/10.36922/ijps.440