
Page 81 - IJPS-9-1
P. 81
International Journal of
Population Studies COVID-19, economic crisis, insomnia, and stress
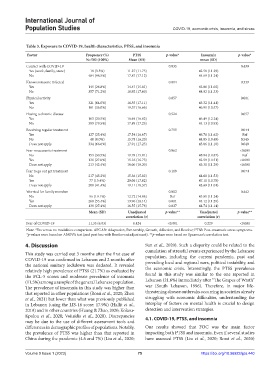
Table 3. Exposure to COVID‑19, health characteristics, PTSS, and insomnia
Factor Frequency (%) PTSS p‑value* Insomnia p‑value*
N=502 (100%) Mean (SD) mean (SD)
Contact with COVID-19 0.035 0.439
Yes (work, family, store) 18 (3.5%) 11.27 (11.75) 42.58 (11.29)
No 484 (96.5%) 17.87 (17.12) 44.69 (11.24)
Knows someone infected 0.004 0.339
Yes 145 (28.8%) 14.47 (15.01) 43.86 (11.02)
No 357 (71.2%) 18.92 (17.60) 44.92 (11.33)
Physical activity 0.057 0.001
Yes 321 (64.0%) 16.55 (17.11) 43.32 (11.41)
No 181 (36.0%) 19.57 (16.66) 46.91 (10.57)
Having a chronic disease 0.524 0.057
Yes 103 (20.5%) 16.69 (16.02) 46.49 (12.24)
No 399 (79.5%) 17.89 (17.25) 44.13 (10.93)
Receiving regular treatment 0.755 0.044
Yes 127 (25.4%) 17.54 (16.67) 46.76 (11.62) Ref
No 40 (8.0%) 15.78 (16.20) 44.05 (10.49) 0.545
Does not apply 334 (66.6%) 17.91 (17.25) 43.86 (11.10) 0.040
Fear no access to treatment 0.062 <0.001
No 153 (30.5%) 19.78 (15.01) 48.94 (10.87) Ref
Yes 136 (27.0%) 15.16 (16.73) 42.59 (10.51) <0.001
Does not apply 213 (42.4%) 18.06 (18.20) 43.31 (11.29) <0.001
Fear to go out get treatment 0.119 0.074
No 217 (43.2%) 15.36 (15.02) 44.60 (11.53)
Yes 77 (15.4%) 20.06 (17.82) 47.11 (10.78)
Does not apply 208 (41.4%) 19.11 (18.37) 43.69 (11.01)
Worried for family member 0.002 0.442
No 96 (19.1%) 12.72 (14.06) Ref 45.81 (11.24)
Yes 268 (53.4%) 19.96 (18.14) 0.001 44.12 (11.29)
Does not apply 138 (27.4%) 16.55 (15.78) 0.037 44.74 (11.14)
Mean (SD) Unadjusted p‑value** Unadjusted p‑value**
correlation (r) correlation (r)
Fear of COVID-19 11.35 (6.03) 0.424 <0.001 0.229 <0.001
Note: *Yes versus no modalities comparison. APGAR: Adaptation, Partnership, Growth, Affection, and Resolve; PTSS: Post-traumatic stress symptoms.
*p-values were based on ANOVA test (and post hoc with Bonferroni adjustment). **p-values were based on Spearman’s correlation test.
4. Discussion Sun et al., 2020). Such a disparity could be related to the
cumulation of stressful events experienced by the Lebanese
This study was carried out 3 months after the first case of population, including the current pandemic, past and
COVID-19 was confirmed in Lebanon and 2 months after prevailing local and regional wars, political instability, and
the national sanitary lockdown was declared. It revealed
relatively high prevalence of PTSS (21.7%) as evaluated by the economic crisis. Interestingly, the PTSS prevalence
the PCL-5 scores and moderate prevalence of insomnia found in this study was similar to the one reported in
(11.5%) among a sample of the general Lebanese population. Lebanon (21.6%) immediately after “The Grapes of Wrath”
The prevalence of insomnia in this study was higher than war (South Lebanon, 1996). Therefore, in major life-
that reported in other populations (Rossi et al., 2020; Zhou threatening disease outbreaks occurring in societies already
et al., 2021) but lower than what was previously published struggling with economic difficulties, understanding the
in Lebanon (using the LIS-18 score: 17.9%) (Hallit et al., interplay of factors on mental health is crucial to design
2019) and in other countries (Huang & Zhao, 2020; Kokou- detection and intervention strategies.
Kpolou et al., 2020; Voitsidis et al., 2020). Discrepancies 4.1. COVID-19, PTSS, and insomnia
may be due to the use of different assessment tools and
differences in demographic profiles of populations. Notably, Our results showed that FOC was the main factor
the prevalence of PTSS was higher than that reported in impacting both PTSS and insomnia. Even if several studies
China during the pandemic (4.6 and 7%) (Liu et al., 2020; have assessed PTSS (Liu et al., 2020; Rossi et al., 2020)
Volume 9 Issue 1 (2023) 75 https://doi.org/10.36922/ijps.440