
Page 107 - IMO-1-1
P. 107
Innovative Medicines & Omics SARS-CoV-2 inhibition by quinolines
pro
pro
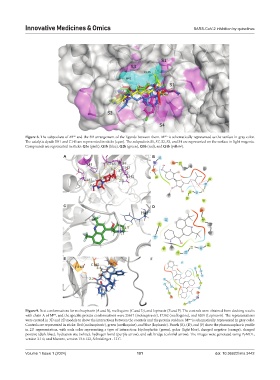
Figure 8. The subpockets of M and the 3D arrangement of the ligands between them. M is schematically represented as the surface in gray color.
The catalytic dyads H41 and C145 are represented in sticks (cyan). The subpockets S1, S1’, S2, S3, and S4 are represented on the surface in light magenta.
Compounds are represented in sticks: Q3a (pink), Q1b (blue), Q2b (green), Q3b (red), and Q4b (yellow).
A B
C D
E F
Figure 9. Best conformations for molnupiravir (A and B), mefloquine (C and D), and lopinavir (E and F). The controls were obtained from docking results
with chain A of M , and the specific protein conformations were 25647 (molnupiravir), 17362 (mefloquine), and 6209 (Lopinavir). The representations
pro
were created in 3D and 2D models to show the interactions between the controls and the protein residues. M is schematically represented in gray color.
pro
Controls are represented in sticks: Red (molnupiravir), green (mefloquine), and blue (lopinavir). Panels (B), (D), and (F) show the pharmacophoric profile
in 2D representation, with each color representing a type of interaction: Hydrophobic (green), polar (light blue), charged negative (orange), charged
positive (dark blue), hydration site (white), hydrogen bond (purple arrow), and salt bridge (colorful arrow). The images were generated using PyMOL,
version 2.1.0, and Maestro, version 13.6.122, Schrödinger - LLC.
Volume 1 Issue 1 (2024) 101 doi: 10.36922/imo.3442