
Page 105 - IMO-1-1
P. 105
Innovative Medicines & Omics SARS-CoV-2 inhibition by quinolines
A B
C D
E
F
G
H
I J
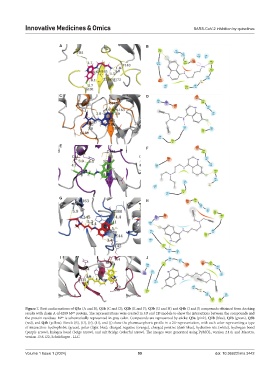
Figure 7. Best conformations of Q3a (A and B); Q1b (C and D); Q2b (E and F); Q3b (G and H) and Q4b (I and J) compounds obtained from docking
results with chain A of 6209 M protein. The representations were created in 3D and 2D models to show the interactions between the compounds and
pro
the protein residues. M is schematically represented in gray color. Compounds are represented by sticks: Q3a (pink), Q1b (blue), Q2b (green), Q3b
pro
(red), and Q4b (yellow). Panels (B), (D), (F), (H), and (J) show the pharmacophoric profile in a 2D representation, with each color representing a type
of interaction: hydrophobic (green), polar (light blue), charged negative (orange), charged positive (dark blue), hydration site (white), hydrogen bond
(purple arrow), halogen bond (beige arrow), and salt bridge (colorful arrow). The images were generated using PyMOL, version 2.1.0, and Maestro,
version 13.6.122, Schrödinger - LLC.
Volume 1 Issue 1 (2024) 99 doi: 10.36922/imo.3442