
Page 101 - IMO-1-1
P. 101
Innovative Medicines & Omics SARS-CoV-2 inhibition by quinolines
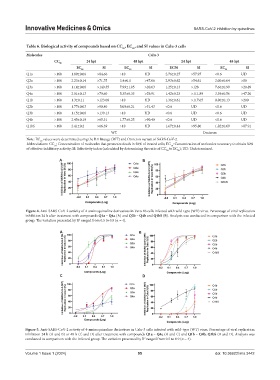
Table 6. Biological activity of compounds based on CC , EC , and SI values in Calu‑3 cells
50 50
Molecules Calu‑3
CC 50 24 hpi 48 hpi 24 hpi 48 hpi
EC SI EC SI EC50 SI EC SI
50 50 50
Q1a >160 1.89±0.06 >84.66 >10 UD 2.76±0.27 >57.97 <0.6 UD
Q2a >160 2.23±0.14 >71.75 3.4±0.1 >47.06 2.93±0.62 >54.61 2.00±0.64 >80
Q3a >160 1.14±0.08 >140.35 7.99±1.05 >20.03 1.25±0.13 >128 7.66±0.99 >20.89
Q4a >160 2.01±0.13 >79.60 5.35±0.33 >29.91 1.42±0.23 >111.89 3.39±0.56 >47.20
Q1b >160 1.3±0.11 >123.08 >10 UD 1.36±0.61 >117.65 0.80±0.13 >200
Q2b >160 1.77±0.03 >90.40 5.09±0.21 >31.43 <0.6 UD <0.6 UD
Q3b >160 1.15±0.08 >139.13 >10 UD <0.6 UD <0.6 UD
Q4b >160 2.45±0.19 >65.31 1.77±0.25 >90.40 <0.6 UD <0.6 UD
Q1bS >160 2.41±0.2 >66.39 >10 UD 1.67±0.44 >95.80 1.82±0.69 >87.91
WT Omicron
Note: EC values were determined using the B.1 lineage (WT) and Omicron variant of SARS-CoV-2.
50
Abbreviations: CC : Concentration of molecules that promotes death in 50% of treated cells; EC : Concentration of molecules necessary to obtain 50%
50
50
of effective inhibitory activity; SI: Selectivity index (calculated by determining the ratio of CC to EC ); UD: Undetermined.
50 50
A B
Figure 4. Anti-SARS-CoV-2 activity of 4-aminoquinoline derivatives in Vero E6 cells infected with wild-type (WT) virus. Percentage of viral replication
inhibition 24 h after treatment with compounds Q1a – Q4a (A) and Q2b – Q4b and Q1bS (B). Analysis was conducted in comparison with the infected
group. The variation presented by R ranged from 0.5 to 0.9 (n = 4).
2
A B
C D
Figure 5. Anti-SARS-CoV-2 activity of 4-aminoquinoline derivatives in Calu-3 cells infected with wild-type (WT) virus. Percentage of viral replication
inhibition 24 h (A and B) or 48 h (C and D) after treatment with compounds Q1a – Q4a (A and C) and Q1b – Q4b, Q1bS (B and D). Analysis was
conducted in comparison with the infected group. The variation presented by R ranged from 0.5 to 0.9 (n = 4).
2
Volume 1 Issue 1 (2024) 95 doi: 10.36922/imo.3442