
Page 99 - IMO-1-1
P. 99
Innovative Medicines & Omics SARS-CoV-2 inhibition by quinolines
Scheme 1. Synthesis of the 4-aminoquinoline derivatives
A
B C
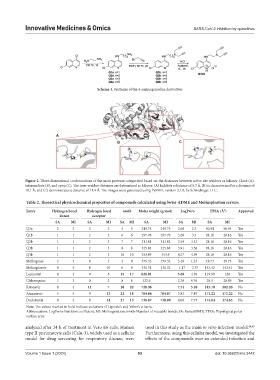
Figure 2. Three-dimensional conformations of the main protease categorized based on the distances between active site residues as follows: Close (A),
intermediate (B), and open (C). The inter-residue distances are determined as follows: (A) Exhibits a distance of 5.3 Å, (B) is characterized by a distance of
10.1 Å, and (C) demonstrates a distance of 11.4 Å. The images were generated using PyMOL, version 2.1.0, by Schrödinger, LLC.
Table 2. Theoretical physicochemical properties of compounds calculated using Swiss‑ADME and Molinspiration servers
Entry Hydrogen bond Hydrogen bond nrotb Molar weight (g/mol) LogPw/o TPSA (Ų) Approved
donor acceptor
SA MI SA MI SA MI SA MI SA MI SA MI
Q3a 2 3 3 3 5 5 249.74 249.75 2.68 2.3 50.94 50.94 Yes
Q1b 1 1 2 3 6 6 297.78 297.79 3.28 3.3 28.16 28.16 Yes
Q2b 1 1 2 3 7 7 311.81 311.82 3.59 3.31 28.16 28.16 Yes
Q3b 1 1 2 3 8 8 325.84 325.84 3.91 3.58 28.16 28.16 Yes
Q4b 1 1 2 3 10 10 353.89 353.9 4.57 4.59 28.16 28.16 Yes
Mefloquine 2 3 8 3 4 4 379.32 379.32 3.18 1.23 49.73 49.73 Yes
Molnupiravir 4 4 8 10 6 6 330.31 330.32 −1.17 −2.57 143.42 143.41 Yes
Lopinavir 4 4 9 5 15 17 628.81 5.69 4.39 119.99 120 Yes
Chloroquine 3 3 0 3 8 8 322.9 2,76 0.76 28.5 28.49 Yes
Ritonavir 4 4 11 7 18 22 720.96 7.51 5.28 145.78 202.26 No
Atazanavir 5 5 9 13 22 18 704.86 704.87 3.82 7.97 171.22 171.22 No
Daclatasvir 4 4 8 14 17 13 738.87 738.89 4.06 7.77 174.64 174.65 No
Note: The values marked in bold indicate violations of Lipinski’s and Veber’s criteria.
Abbreviations: LogPw/o: Partition coefficient; MI: Molinspiration; nrotb: Number of rotatable bonds; SA: SwissADME; TPSA: Topological polar
surface area.
analyzed after 24 h of treatment in Vero E6 cells. Human used in this study as the main in vitro infection model. 44,45
type II pneumocyte cells (Calu-3), widely used as a cellular Furthermore, using this cellular model, we investigated the
model for drug screening for respiratory disease, were effects of the compounds over an extended infection and
Volume 1 Issue 1 (2024) 93 doi: 10.36922/imo.3442