
Page 98 - IMO-1-1
P. 98
Innovative Medicines & Omics SARS-CoV-2 inhibition by quinolines
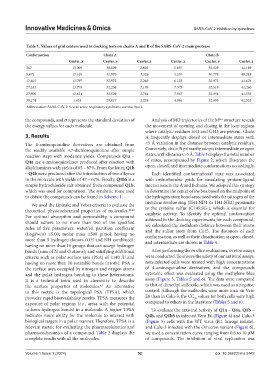
Table 1. Values of grid centers used in docking tests on chains A and B of the SARS‑CoV‑2 main protease
Conformation Chain A Chain B
Center_x Center_y Center_z Center_x Center_y Center_z
267 −15.009 −30.809 2.602 5.857 −32.129 41.189
5,671 −17.105 −32.970 3.326 5.257 −30.779 40.249
13,403 −13.797 −32.972 2.249 6.123 −32.972 41.676
27,333 −13.776 −32.208 3.199 7.573 −32.519 41.260
27,906 −12.421 −32.509 2.764 7.567 −32.194 41.535
38,174 −1.624 −29.817 2.224 4.946 −32.800 41.553
Abbreviation: SARS-CoV-2: Severe acute respiratory syndrome coronavirus 2.
the compounds, and σ represents the standard deviation of Analysis of MD trajectories of the M structure reveals
pro
the energy values for each molecule. the movement of opening and closing in the loop regions
where catalytic residues H41 and C145 are present. Chain
3. Results A frequently displays closed or intermediate states with
The 4-aminoquinoline derivatives are obtained from <5 Å variation in the distance between catalytic residues.
the readily available 4,7-dichloroquinoline after simple Conversely, chain B primarily adopts intermediate or open
reaction steps with moderate yields. Compounds Q1a – states, with distances >5 Å. Table 3 displays the total number
Q4a are 4-aminoquinolines produced after reaction with of states, accompanied by Figure 2, which illustrates the
alkyldiamines with yields of 65 – 87%. From the latter, Q1b open, closed, and intermediate conformations accordingly.
– Q4b were produced after the introduction of two alkynes Each identified conformational state was associated
in the molecule with yields of 47 – 62%. Finally, Q1bS is a with orthorhombic grids for simulating protein-ligand
simple hydrochloride salt obtained from compound Q1b, interactions in the A and B chains. We adopted this strategy
which was used for comparison. The synthetic route used to determine the center of the box based on the midpoint of
to obtain the compounds can be found in Scheme 1. the hydrogen atom bond associated with the nitrogen of the
histidine residue ring (H41:ND1 or H41:NE2) proximate
We used the Lipinski and Veber criteria to evaluate the
theoretical physicochemical properties of molecules. 41,42 to the cysteine sulfur (C145:SG-), which is essential for
For optimal absorption and permeability, a compound catalytic activity. To identify the optimal conformation
achieved in the docking experiments for each compound,
should adhere to no more than two of the specified we calculated the Euclidean distance between their atoms
rules of five parameters: water/oil partition coefficient and the sulfur atom from C145. The distances of each
(LogPw/o) ≤5.00; molar mass ≤500 g/mol; having no conformation, as well as their classification as open, closed,
more than 5 hydrogen donors (OH and NH combined); and intermediate are shown in Table 4.
having no more than 10 groups that can accept hydrogen
bonds (sum of N and O atoms); and satisfying additional After performing the in silico evaluations, in vitro assays
criteria such as polar surface area (PSA) of ≤140 Å and were conducted. To ensure the safety of our antiviral assays,
2
having no more than 10 rotatable bonds (nrotb). PSA is non-infected cells were treated with high concentrations
the surface area occupied by nitrogen and oxygen atoms of 4-aminoquinoline derivatives, and the compounds
and the polar hydrogen bonding to these heteroatoms. cytotoxic effect was evaluated using the methylene blue
It is a technical term used in chemistry to describe assay (Figure 3, Tables 5 and 6). The data were compared
the surface properties of molecules. An alternative to that of dimethyl sulfoxide, which was used as a negative
43
to this metric is the topological PSA (TPSA), which control. Although the molecules were more toxic in Vero
provides rapid bioavailability results. TPSA measures the E6 than in Calu-3, the CC values for both cells were high
50
exposure of polar regions (i.e., areas with the potential compared to others in the literature (Tables 5 and 6).
to form hydrogen bonds) in a molecule. A higher TPSA To evaluate the antiviral activity of Q1a – Q4a, Q1b –
indicates more ability for the molecule to interact with Q4b, and Q1bS in infected Vero E6 (Figure 4) and Calu-3
biological targets in a polar manner. Therefore, TPSA is a (Figure 5) cells with the WT virus (B.1 lineage isolate),
relevant metric for evaluating the pharmacokinetics and and Calu-3 infected with the Omicron variant (Figure 6),
pharmacodynamics of a compound. Table 2 displays the we used a concentration curve ranging from 0.6 to 10 µM
complete results with all the molecules. of compounds. The inhibition of viral replication was
Volume 1 Issue 1 (2024) 92 doi: 10.36922/imo.3442