
Page 100 - IMO-1-1
P. 100
Innovative Medicines & Omics SARS-CoV-2 inhibition by quinolines
A B
C D
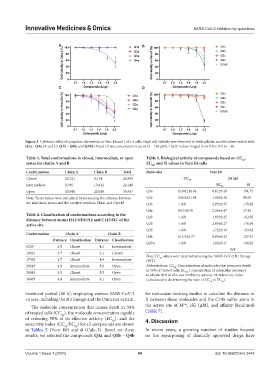
Figure 3. Cytotoxic effect of quinoline derivatives in Vero E6 and Calu-3 cells. High cell viability was observed in both cellular models when treated with
Q1a – Q4a (A and C), Q1b – Q4b, and Q1bS (B and D) at a concentration curve (5 – 160 µM). The R values ranged from 0.8 to 0.9 (n = 4).
2
Table 3. Total conformations in closed, intermediate, or open Table 5. Biological activity of compounds based on CC ,
50
states for chains A and B EC , and SI values in Vero E6 cells
50
Conformation Chain A Chain B Total Molecules Vero E6
Closed 20,721 6,174 26,895 CC 50 24 hpi
Intermediate 8,336 13,812 22,148 EC 50 SI
Open 10,948 20,019 30,967 Q1a 118.8±14.64 0.61±0.26 194.75
Note: These values were calculated by measuring the distance between Q2a 136.0±21.68 1.58±0.16 86.65
the side chain atoms and the catalytic residues, His41 and Cys145. Q3a >160 2.03±0.35 >78.82
Q4a 84.7±9.78 2.24±0.47 37.82
Table 4. Classification of conformations according to the
distance between atoms H41:ND1/NE and C145:SG‑ of the Q1b >160 1.95±0.25 >82.05
active site Q2b >160 2.09±0.27 >76.56
Q3b >160 1.72±0.19 >93.02
Conformation Chain A Chain B
Q4b 113.5±5.37 0.89±0.32 127.53
Distance Classification Distance Classification
Q1bS >160 1.86±0.17 >86.02
6209 2.9 Closed 4.3 Intermediate WT
10531 3.7 Closed 2.1 Closed
Note: EC values were determined using the SARS-CoV-2 B.1 lineage
17362 3.7 Closed 4.4 Intermediate (WT). 50
25647 4.9 Intermediate 5.9 Open Abbreviations: CC : Concentration of molecules that promotes death
50
in 50% of treated cells; EC : Concentration of molecules necessary
28983 3.5 Closed 5.5 Open 50
to obtain 50% of effective inhibitory activity; SI: Selectivity index
36867 4.4 Intermediate 6.1 Open (calculated by determining the ratio of CC to EC ).
50 50
treatment period (48 h), employing various SARS-CoV-2 for molecular docking studies to calculate the distance in
viruses, including the B.1 lineage and the Omicron variant. Å between these molecules and the C145 sulfur atom in
pro
The molecule concentration that causes death in 50% the active site of M , cKi (µM), and affinity (kcal/mol)
of treated cells (CC ), the molecule concentration capable (Table 7).
50
of reducing 50% of its effective activity (EC ), and the 4. Discussion
50
selectivity index (CC /EC ) for all compounds are shown
50
50
in Tables 5 (Vero E6) and 6 (Calu-3). Based on these In recent years, a growing number of studies focused
results, we selected the compounds Q3a and Q1b – Q4b on the repurposing of clinically approved drugs have
Volume 1 Issue 1 (2024) 94 doi: 10.36922/imo.3442