
Page 92 - IMO-2-2
P. 92
Innovative Medicines & Omics Femtomolar inhibition of pseudoeriocitrin
A B
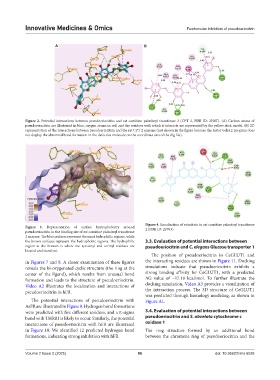
Figure 2. Potential interactions between pseudoeriocitrin and rat carnitine palmitoyl transferase 2 (CPT 2, PDB ID: 2H4T). (A) Carbon atoms of
pseudoeriocitrin are illustrated in blue, oxygen atoms in red, and the residues with which it interacts are represented by the yellow stick model. (B) 2D
representation of the interactions between pseudoeriocitrin and the rat CPT 2 enzyme (not shown in the figure because the AutoDock4.2 program does
not display the abnormal bond formation in the defective molecule on the coordinate axis of the dlg file).
Figure 4. Localization of eriocitrin in rat carnitine palmitoyl transferase
Figure 3. Representation of surface hydrophobicity around 2 (PDB ID: 2FW3)
pseudoeriocitrin in the binding site of rat carnitine palmitoyl transferase
2 enzyme. The blue surfaces represent the most hydrophilic regions, while
the brown surfaces represent the hydrophobic regions. The hydrophilic 3.3. Evaluation of potential interactions between
region at the bottom is where the tyrosinyl and serinyl residues are pseudoeriocitrin and C. elegans Glucose transporter 1
located and stand out.
The position of pseudoeriocitrin in CeGLUT1 and
in Figures 7 and 8. A closer examination of these figures the interacting residues are shown in Figure 11. Docking
reveals the bi-oxygenated cyclic structure (the ring at the simulations indicate that pseudoeriocitrin exhibits a
center of the ligand), which results from unusual bond strong binding affinity for CeGLUT1, with a predicted
formation and leads to the structure of pseudoeriocitrin. ΔG value of −17.18 kcal/mol. To further illustrate the
Video A2 illustrates the localization and interactions of docking simulation, Video A3 provides a visualization of
pseudoeriocitrin in hFR. the interaction process. The 3D structure of CeGLUT1
was predicted through homology modeling, as shown in
The potential interactions of pseudoeriocitrin with Figure A1.
AsFR are illustrated in Figure 9. Hydrogen bond formations
were predicted with five different residues, and a π-sigma 3.4. Evaluation of potential interactions between
bond with THR81 is likely to occur. Similarly, the potential pseudoeriocitrin and S. obvelata cytochrome c
interactions of pseudoeriocitrin with hFR are illustrated oxidase 1
in Figure 10. We identified 12 predicted hydrogen bond The ring structure formed by an additional bond
formations, indicating strong inhibition with hFR. between the chromene ring of pseudoeriocitrin and the
Volume 2 Issue 2 (2025) 86 doi: 10.36922/imo.6026