
Page 43 - ITPS-6-1
P. 43
37 INNOSC Theranostics and Pharmacological Sciences, 2023, Vol. 6, No. 1 Hariharan
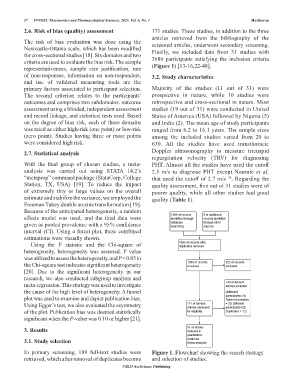
2.6. Risk of bias (quality) assessment 171 studies. These studies, in addition to the three
articles retrieved from the bibliography of the
The risk of bias evaluation was done using the screened articles, underwent secondary screening.
Newcastle-Ottawa scale, which has been modified
for cross-sectional studies [18]. Six domains and two Finally, we included data from 31 studies with
criteria are used to evaluate the bias risk. The sample 3686 participants satisfying the inclusion criteria
representativeness, sample size justification, rate (Figure 1) [13-16,22-48].
of non-responses, information on non-responders, 3.2. Study characteristics
and use of validated measuring tools are the
primary factors associated to participant selection. Majority of the studies (11 out of 31) were
The second criterion relates to the participants’ prospective in nature, while 10 studies were
outcomes and comprises two subdomains: outcome retrospective and cross-sectional in nature. Most
assessment using a blinded, independent assessment studies (19 out of 31) were conducted in United
and record linkage, and statistical tests used. Based States of America (USA) followed by Nigeria (5)
on the degree of bias risk, each of these domains and India (2). The mean age of study participants
was rated as either high-risk (one point) or low-risk ranged from 6.2 to 16.1 years. The sample sizes
(zero point). Studies having three or more points among the included studies varied from 20 to
were considered high risk. 630. All the studies have used transthoracic
2.7. Statistical analysis Doppler ultrasonography to measure tricuspid
regurgitation velocity (TRV) for diagnosing
With the final group of chosen studies, a meta- PHT. Almost all the studies have used the cutoff
analysis was carried out using STATA 14.2’s 2.5 m/s to diagnose PHT except Nouraie et al.
“metaprop” command package (StataCorp, College that used the cutoff of 2.7 m/s . Regarding the
38
Station, TX, USA) [19]. To reduce the impact quality assessment, five out of 31 studies were of
of extremely tiny or large values on the overall poorer quality, while all other studies had good
estimate and stabilize the variance, we employed the quality (Table 1).
Freeman Tukey double arcsine transformation [19].
Because of the anticipated heterogeneity, a random
effects model was used, and the final data were
given as pooled prevalence with a 95% confidence
interval (CI). Using a forest plot, these combined
estimations were visually shown.
Using the I statistic and the Chi-square of
2
heterogeneity, heterogeneity was assessed. I value
2
was utilized to assess the heterogeneity, and P < 0.05 in
the Chi-square test indicates significant heterogeneity
[20]. Due to the significant heterogeneity in our
research, we also conducted subgroup analysis and
meta-regression. This strategy was used to investigate
the cause of the high level of heterogeneity. A funnel
plot was used to examine and depict publication bias.
Using Egger’s test, we also evaluated the asymmetry
of the plot. Publication bias was deemed statistically
significant when the P-value was 0.10 or higher [21].
3. Results
3.1. Study selection
In primary screening, 189 full-text studies were Figure 1. Flowchart showing the search strategy
retrieved, which after removal of duplicates become and selection of studies.
©2023 AccScience Publishing