
Page 109 - JCAU-5-2
P. 109
Journal of Chinese
Architecture and Urbanism Study on ecosystem service value in Wuhan
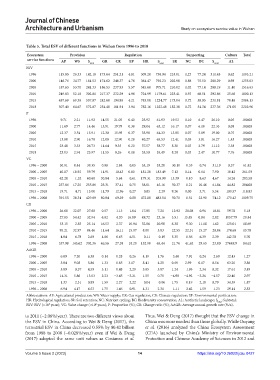
Table 5. Total ESV of different functions in Wuhan from 1996 to 2018
Ecosystem Provision Regulation Supporting Culture Total
service functions AP WS S total GR CR EP HR S total SR NC BC S total AL
ESV
1996 115.85 26.33 142.18 173.64 251.21 4.81 309.28 738.94 233.01 1.23 77.24 311.48 0.62 1193.21
2000 146.76 34.77 181.53 174.62 248.37 4.76 364.47 792.23 202.90 0.88 76.50 280.29 0.98 1255.03
2005 187.63 53.70 241.33 186.53 237.93 5.57 545.68 975.71 210.02 1.02 77.14 288.19 11.40 1516.63
2010 249.83 52.18 302.01 217.37 232.29 4.96 724.99 1179.61 223.41 0.93 68.51 292.86 25.66 1800.13
2015 487.69 69.38 557.07 242.68 194.88 4.21 783.00 1224.77 173.04 0.72 58.05 231.81 70.48 2084.13
2018 507.40 64.67 572.07 254.48 181.91 3.94 782.16 1222.48 182.30 0.72 54.34 237.36 171.05 2202.96
P
1996 9.71 2.21 11.92 14.55 21.05 0.40 25.92 61.93 19.53 0.10 6.47 26.10 0.05 100.00
2000 11.69 2.77 14.46 13.91 19.79 0.38 29.04 63.12 16.17 0.07 6.10 22.33 0.08 100.00
2005 12.37 3.54 15.91 12.30 15.69 0.37 35.98 64.33 13.85 0.07 5.09 19.00 0.75 100.00
2010 13.88 2.90 16.78 12.08 12.90 0.28 40.27 65.53 12.41 0.05 3.81 16.27 1.43 100.00
2015 23.40 3.33 26.73 11.64 9.35 0.20 37.57 58.77 8.30 0.03 2.79 11.12 3.38 100.00
2018 23.03 2.94 25.97 11.55 8.26 0.18 35.50 55.49 8.28 0.03 2.47 10.77 7.76 100.00
VC
1996 – 2000 30.91 8.44 39.35 0.98 −2.84 −0.05 55.19 53.28 −30.10 −0.35 −0.74 −31.19 0.37 61.82
2000 – 2005 40.87 18.92 59.79 11.91 −10.43 0.80 181.20 183.49 7.12 0.14 0.64 7.90 10.42 261.59
2005 – 2010 62.20 −1.52 60.68 30.84 −5.64 −0.61 179.31 203.90 13.39 −0.10 −8.63 4.67 14.26 283.50
2010 – 2015 237.86 17.20 255.06 25.31 −37.41 −0.75 58.01 45.16 −50.37 −0.21 −10.46 −61.04 44.82 284.00
2015 – 2018 19.71 −4.71 15.00 11.79 −12.96 −0.27 −0.85 −2.29 9.26 0.00 −3.71 5.54 100.57 118.83
1996 – 2008 391.55 38.34 429.89 80.84 −69.29 −0.88 472.88 483.54 −50.70 −0.51 −22.90 −74.12 170.43 1009.75
CR
1996 – 2000 26.68 32.07 27.68 0.57 −1.13 −1.04 17.85 7.21 −12.92 −28.08 −0.96 −10.01 59.78 5.18
2000 – 2005 27.85 54.42 32.94 6.82 −4.20 16.89 49.72 23.16 3.51 15.85 0.84 2.82 1057.79 20.84
2005 – 2010 33.15 −2.83 25.14 16.53 −2.37 −10.94 32.86 20.90 6.38 −9.30 −11.18 1.62 125.01 18.69
2010 – 2015 95.21 32.97 84.46 11.64 −16.11 −15.07 8.00 3.83 −22.55 −22.31 −15.27 −20.84 174.68 15.78
2015 – 2018 4.04 −6.78 2.69 4.86 −6.65 −6.51 −0.11 −0.19 5.35 −0.56 −6.39 2.39 142.70 5.70
1996 – 2008 337.98 145.62 302.36 46.56 −27.58 −18.20 152.90 65.44 −21.76 −41.62 −29.65 −23.80 27649.9 84.62
AAGR
1996 – 2000 6.09 7.20 6.30 0.14 −0.28 −0.26 4.19 1.76 −3.40 −7.91 −0.24 −2.60 12.43 1.27
2000 – 2005 5.04 9.08 5.86 1.33 −0.85 3.17 8.41 4.25 0.69 2.99 0.17 0.56 63.20 3.86
2005 – 2010 5.89 −0.57 4.59 3.11 −0.48 −2.29 5.85 3.87 1.24 −1.93 −2.34 0.32 17.61 3.49
2010 – 2015 14.31 5.86 13.03 2.23 −3.45 −3.21 1.55 0.75 −4.98 −4.92 −3.26 −4.57 22.40 2.97
2015 – 2018 1.33 −2.31 0.89 1.59 −2.27 −2.22 −0.04 −0.06 1.75 −0.19 −2.18 0.79 34.39 1.87
1996 – 2008 6.94 4.17 6.53 1.75 −1.46 −0.91 4.31 2.31 −1.11 −2.42 −1.59 −1.23 29.14 2.83
Abbreviations: AP: Agricultural production; WS: Water supply; GR: Gas regulation; CR: Climate regulation; EP: Environmental purification;
HR: Hydrological regulation; SR: Soil retention; NC: Nutrient cycling; BC: Biodiversity conservation; AL: Aesthetic landscape; S total : Subtotal;
ESV: ESV (×10 yuan); VC: Value change (×10 yuan); P: Proportion (%); CR: Change ratio (%); AAGR: Average annual growth rate (%/a).
8
8
to 2011 (−2.06%/year). There are two different views about Thus, Wei & Deng (2017) thought that the ESV change in
the ESV in China. According to Wei & Deng (2017), the China was more modest than those globally. While Ouyang
terrestrial ESV in China decreased 0.55% by $0.42 billion et al. (2016) analyzed the China Ecosystem Assessment
from 1988 to 2008 (−0.028%/year) even if Wei & Deng (CEA) launched by China’s Ministry of Environmental
(2017) adopted the same unit values as Costanza et al. Protection and Chinese Academy of Sciences in 2012 and
Volume 5 Issue 2 (2023) 14 https://doi.org/10.36922/jcau.0427