
Page 105 - JCAU-5-2
P. 105
Journal of Chinese
Architecture and Urbanism Study on ecosystem service value in Wuhan
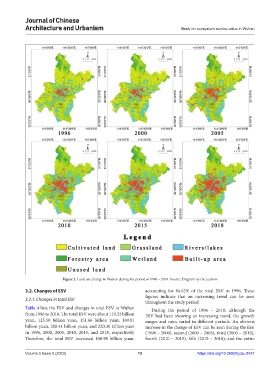
Figure 2. Land use change in Wuhan during the period of 1996 – 2018. Source: Diagram by the authors
3.2. Changes of ESV accounting for 84.62% of the total ESV in 1996. These
figures indicate that an increasing trend can be seen
3.2.1. Changes in total ESV
throughout the study period.
Table 4 lists the ESV and changes in total ESV in Wuhan During the period of 1996 – 2018, although the
from 1996 to 2018. The total ESV were about 119.32 billion ESV had been showing an increasing trend, the growth
yuan, 125.50 billion yuan, 151.66 billion yuan, 180.01 ranges and rates varied in different periods. An obvious
billion yuan, 208.41 billion yuan, and 220.30 billion yuan increase in the change of ESV can be seen during the first
in 1996, 2000, 2005, 2010, 2015, and 2018, respectively. (1996 – 2000), second (2000 – 2005), third (2005 – 2010),
Therefore, the total ESV increased 100.98 billion yuan, fourth (2010 – 2015), fifth (2015 – 2018), and the entire
Volume 5 Issue 2 (2023) 10 https://doi.org/10.36922/jcau.0427