
Page 108 - JCAU-5-2
P. 108
Journal of Chinese
Architecture and Urbanism Study on ecosystem service value in Wuhan
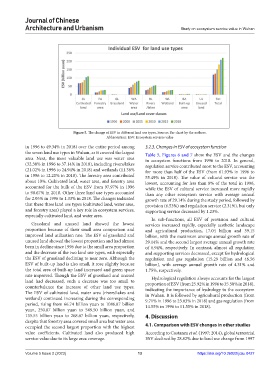
Figure 5. The change of ESV in different land use types. Source: Bar chart by the authors.
Abbreviation: ESV: Ecosystem services value
in 1996 to 49.34% in 2018) over the entire period among 3.2.3. Changes in ESV of ecosystem function
the seven land use types in Wuhan, as it covered the largest Table 5, Figures 6 and 7 show the ESV and the changes
area. Next, the most valuable land use was water area in ecosystem functions from 1996 to 2018. In general,
(32.38% in 1996 to 37.14% in 2018), including rivers/lakes regulation service contributed most to the ESV, accounting
(21.02% in 1996 to 24.94% in 2018) and wetlands (11.36% for more than half of the ESV (from 61.93% in 1996 to
in 1996 to 12.20% in 2018). The forestry area contributed 55.49% in 2018). The value of cultural service was the
about 10%. Cultivated land, water area, and forestry area lowest, accounting for less than 8% of the total in 1996,
accounted for the bulk of the ESV from 97.97% in 1996 while the ESV of cultural service increased more rapidly
to 98.67% in 2018. Other three land use types accounted than any other ecosystem service with average annual
for 2.05% in 1996 to 1.33% in 2018. The changes indicated growth rate of 29.14% during the study period, followed by
that these three land use types (cultivated land, water area, provision (6.53%) and regulation service (2.31%), but only
and forestry area) played a key role in ecosystem services, supporting service decreased by 1.23%.
especially cultivated land, and water area.
In sub-functions, all ESV of provision and cultural
Grassland and unused land showed the lowest services increased rapidly, especially aesthetic landscape
proportion because of their small area comparison and and agricultural production, 17.04 billion and 39.15
improved land utilization rate. The ESV of grassland and billion, with the maximum average annual growth rate of
unused land showed the lowest proportion and had almost 29.14% and the second largest average annual growth rate
been in decline since 1996 due to the small area proportion of 6.94%, respectively. In contrast, almost all regulation
and the decrease of the two land use types, with especially and supporting services decreased, except for hydrological
the ESV of grassland declining to near zero. Although the regulation and gas regulation (15.29 billion and 46.56
ESV of built-up land is also small, it rose slightly because billion), with average annual growth rate of 4.31% and
the total area of built-up land increased and green space 1.75%, respectively.
rate improved. Though the ESV of grassland and unused Hydrological regulation always accounts for the largest
land had decreased, such a decrease was too small to proportion of ESV (from 25.92% in 1996 to 35.50% in 2018),
counterbalance the increase of other land use types. indicating the importance of hydrology to the ecosystem
The ESV of cultivated land, water area (rivers/lakes and in Wuhan. It is followed by agricultural production (from
wetland) continued increasing during the corresponding 9.71% in 1996 to 23.03% in 2018) and gas regulation (from
period, rising from 66.74 billion yuan to 1086.87 billion 14.55% in 1996 to 11.55% in 2018).
yuan, 250.87 billion yuan to 549.50 billion yuan, and
135.55 billion yuan to 268.67 billion yuan, respectively, 4. Discussion
despite that forestry area covered small area but water area
occupied the second largest proportion with the highest 4.1. Comparison with ESV changes in other studies
value coefficients. Cultivated land also produced high According to Costanza et al. (1997; 2014), global terrestrial
service value due to its large area coverage. ESV declined by 28.82% due to land use change from 1997
Volume 5 Issue 2 (2023) 13 https://doi.org/10.36922/jcau.0427