
Page 104 - JCAU-5-2
P. 104
Journal of Chinese
Architecture and Urbanism Study on ecosystem service value in Wuhan
by water area and built-up land. These three land use land were negative, meaning their areas declined
categories accounted for approximately 87% of the total continuously during the period of 1996 – 2018. While
area, while the other three land use categories (forestry the area of built-up land increased continuously because
area, grassland, and unused land) together covered almost the K of the built-up land was positive. The forestry
13% of the total area. area and water area increased first in 1996 – 2010 and
Land use in Wuhan underwent drastic changes from then decreased in 2010 – 2018 in that K>0 first and then
1996 to 2018, a period characterized by a decrease in K<0. The grassland varied greatly with the largest K, and
cultivated land, unused land, and grassland, and an the area of grassland approached zero in 2018, but the
increase in built-up land, forestry area, and water area change area was the smallest because of its minimum
(Figure 3). The cultivated land declined from 49.40% absolute area.
(422322.06 hm ) in 1996 to 35.12% (300987.73 hm ) in In 1996 – 2000, the K of each type was the smallest;
2
2
2018, unused land from 2.14% (21043.81 hm ) in 1996 to only the K of farmland and unused land decreased, while
2
0.44% (3774.80 hm ) in 2018, and grassland from 2.14% the K of other land types increased. After 2000, most of
2
(6901.47 hm ) in 1996 to 0.0002% (2.14 hm ) in 2018. the cities in China, including Wuhan, have successively
2
2
On the contrary, built-up land increased from 14.96% entered the era of speeded urbanization with the
2
2
(127917.35 hm ) in 1996 to 24.41% (209182.2 hm ) in accelerated economic growth. The characteristics of
2018, water area from 23.29% (199132.27 hm ) in 1996 land use in Wuhan were a rapid expansion of built-up
2
to 28.05% (240394.99 hm ) in 2018, forestry area from land and a sharp decline in cultivated land. Forestry
2
9.08% (77583.57 hm ) in 1996 to 11.97% (102572.73 hm ) area and water area increased and reached the peak in
2
2
in 2018. 2010 and then decreased slightly. Grassland continued
The single land use dynamic degree (K) is shown to decline to close to zero in 2010 and then remained
in Table 3. The K of the cultivated land and unused unchanged.
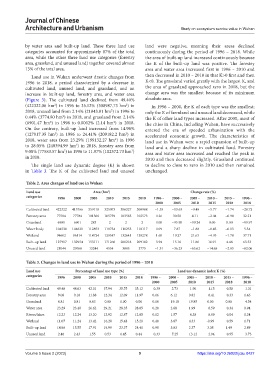
Table 2. Area changes of land use in Wuhan
Land use Area (hm ) Change rate (%)
2
categories 1996 2000 2005 2010 2015 2018 1996 – 2000 – 2005 – 2010 – 2015 – 1996 –
2000 2005 2010 2015 2018 2018
Cultivated land 422322 415766 359118 325073 306327 300988 −1.55 −13.63 −9.48 −5.77 −1.74 −28.73
Forestry area 77584 77784 101566 105739 103585 102573 0.26 30.58 4.11 −2.04 −0.98 32.21
Grassland 6901 6901 283 2 2 2 0.00 −95.90 −99.24 0.00 0.00 −99.97
Water body 104530 104621 112853 110734 110255 110117 0.09 7.87 −1.88 −0.43 −0.13 5.34
Wetland 94602 96114 114734 139547 132641 130278 1.60 19.37 21.63 −4.95 −1.78 37.71
Built-up land 127917 132954 153111 171266 200218 209182 3.94 15.16 11.86 16.91 4.48 63.53
Unused land 21044 20768 13244 4554 3885 3775 −1.31 −36.23 −65.62 −14.68 −2.85 −82.06
Table 3. Changes in land use in Wuhan during the period of 1996 – 2018
Land use Percentage of land use type (%) Land use dynamic index K (%)
categories 1996 2000 2005 2010 2015 2018 1996 – 2000 – 2005 – 2010 – 2015 – 1996 –
2000 2005 2010 2015 2018 2018
Cultivated land 49.40 48.63 42.01 37.94 35.75 35.12 −0.39 −2.73 −1.90 −1.15 −0.58 −1.31
Forestry area 9.08 9.10 11.88 12.34 12.09 11.97 0.06 6.12 0.82 −0.41 −0.33 1.46
Grassland 0.81 0.81 0.03 0.00 0.00 0.00 0.00 −19.18 −19.85 0.00 0.00 −4.54
Water area 23.29 23.48 26.62 29.21 28.35 28.05 0.20 2.68 1.99 −0.59 −0.34 0.94
Rivers/lakes 12.23 12.24 13.20 12.92 12.87 12.85 0.02 1.57 −0.38 −0.09 −0.04 0.24
Wetland 11.07 11.24 13.42 16.28 15.48 15.20 0.40 3.87 4.33 -0.99 −0.59 1.71
Built-up land 14.96 15.55 17.91 19.99 23.37 24.41 0.98 3.03 2.37 3.38 1.49 2.89
Unused land 2.46 2.43 1.55 0.53 0.45 0.44 −0.33 −7.25 −13.12 −2.94 −0.95 −3.73
Volume 5 Issue 2 (2023) 9 https://doi.org/10.36922/jcau.0427