
Page 107 - JCAU-5-2
P. 107
Journal of Chinese
Architecture and Urbanism Study on ecosystem service value in Wuhan
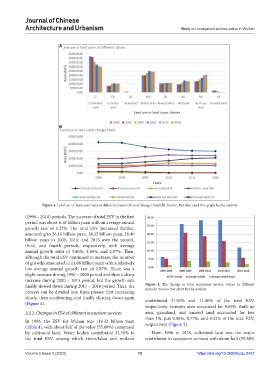
A
B
Figure 3. Land use or land cover area of different classes (A) and change trend (B). Source: Bar chart and line graph by the authors
(1996 – 2018) periods. The increase of total ESV in the first
period was about 6.18 billion yuan with an average annual
growth rate of 1.27%. The total ESV increased further,
amounting to 26.16 billion yuan, 28.35 billion yuan, 28.40
billion yuan in 2005, 2010, and 2015 over the second,
third, and fourth periods, respectively, with average
annual growth rates of 3.86%, 3.49%, and 2.97%. Then,
although the total ESV continued to increase, the number
of growths amounted to 11.88 billion yuan with a relatively
low average annual growth rate of 1.87%. There was a
slight increase during 1996 – 2000 period and then a sharp
increase during 2000 – 2015 period, but the growth rate
finally slowed down during 2015 – 2018 period. Thus, the Figure 4. The change in total ecosystem service values in different
process can be divided into three phases: first increasing periods. Source: Bar chart by the authors
slowly, then accelerating, and finally slowing down again contributed 21.02% and 11.36% of the total ESV,
(Figure 4).
respectively. Forestry area accounted for 9.69%. Built-up
3.2.2. Changes in ESV of different ecosystem services area, grassland, and unused land accounted for less
than 1%, just 0.96%, 0.77%, and 0.32% of the total ESV,
In 1996, the ESV for Wuhan was 119.32 billion yuan
(Table 4), with about half of the value (55.88%) comprised respectively (Figure 5).
by cultivated land. Water bodies contributed 32.38% to From 1996 to 2018, cultivated land was the major
the total ESV, among which rivers/lakes and wetland contributor to ecosystem services with about half (55.88%
Volume 5 Issue 2 (2023) 12 https://doi.org/10.36922/jcau.0427