
Page 36 - JCAU-5-3
P. 36
Journal of Chinese
Architecture and Urbanism Walkability evaluation of Beijing Old Town
Table 1. Concept and data source of street walkability index
First-order Number Secondary index Index concept Data source
index
Street 01 Street width Road red line width Road source data property sheet
interface downloaded OpenStreetMap
02 Average building height Average height of buildings on both sides of street Street view picture
Street aspect ratio Ratio of one side building to road width Single side building height/
03 Higher side street aspect ratio street width
04 Lower side street aspect ratio
Street continuity The ratio of the length of the building interface to the Continuous length of unilateral
05 Street wall continuity, more length of the street within 200 m on one side of the building /200 m
continuity side street
06 Street wall continuity, less
continuity side
Street 07 Motorway Bike lanes are one of the street components in Street view image semantic
furniture pedestrian-friendly scale segmentation, elements of the
08 Fence Iron fence between motorway and non-motorway street view map area
09 Green barrier Isolation green belt between two-way traffic lanes and
between motor vehicles and non-motor vehicles
10 Street sign The sign facility appears in the street view image
Street style 11 Architectural quality and Evaluation is carried out on the standards such as Virtual audit method
design aesthetics the unity of architectural color, construction age and
building height in street view pictures
12 The extent of street The number of garbage cans in the street view, the
maintenance management level of cleanliness of the street, and whether the
motor vehicle parking is orderly were evaluated
13 The degree of preservation of How many traditional elements of street view,
traditional features attractiveness, and other standards for evaluation
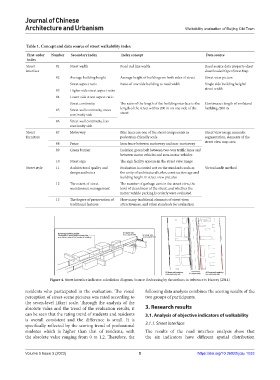
Figure 4. Street interface indicator calculation diagram. Source: Redrawing by the authors in reference to Harvey (2014)
residents who participated in the evaluation. The visual following data analysis combines the scoring results of the
perception of street-scene pictures was rated according to two groups of participants.
the seven-level Likert scale. Through the analysis of the
absolute value and the trend of the evaluation results, it 3. Research results
can be seen that the rating trend of students and residents 3.1. Analysis of objective indicators of walkability
is overall consistent and the difference is small. It is
specifically reflected by the scoring trend of professional 3.1.1. Street interface
students which is higher than that of residents, with The results of the road interface analysis show that
the absolute value ranging from 0 to 1.2. Therefore, the the six indicators have different spatial distribution
Volume 5 Issue 3 (2023) 5 https://doi.org/10.36922/jcau.1033