
Page 62 - JCAU-5-3
P. 62
Journal of Chinese
Architecture and Urbanism Ecosystem service evaluation on ecological restoration
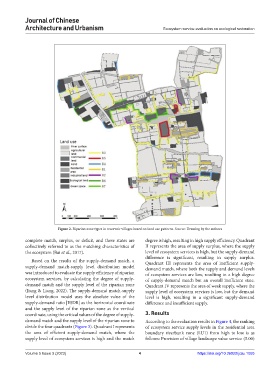
Figure 2. Riparian zone types in reservoir villages based on land use patterns. Source: Drawing by the authors
complete match, surplus, or deficit, and these states are degree is high, resulting in high supply efficiency. Quadrant
collectively referred to as the matching characteristics of II represents the area of supply surplus, where the supply
the ecosystem (Bai et al., 2017). level of ecosystem services is high, but the supply-demand
difference is significant, resulting in supply surplus.
Based on the results of the supply-demand match, a Quadrant III represents the area of inefficient supply-
supply-demand match-supply level distribution model demand match, where both the supply and demand levels
was introduced to evaluate the supply efficiency of riparian of ecosystem services are low, resulting in a high degree
ecosystem services, by calculating the degree of supply- of supply-demand match but an overall inefficient state.
demand match and the supply level of the riparian zone Quadrant IV represents the area of weak supply, where the
(Jiang & Liang, 2022). The supply-demand match-supply supply level of ecosystem services is low, but the demand
level distribution model uses the absolute value of the level is high, resulting in a significant supply-demand
supply-demand ratio |ESDR| as the horizontal coordinate difference and insufficient supply.
and the supply level of the riparian zone as the vertical
coordinate, using the critical values of the degree of supply- 3. Results
demand match and the supply level of the riparian zone to According to the evaluation results in Figure 4, the ranking
divide the four quadrants (Figure 3). Quadrant I represents of ecosystem service supply levels in the residential area
the area of efficient supply-demand match, where the boundary riverbank zone (LU1) from high to low is as
supply level of ecosystem services is high and the match follows: Provision of village landscape value service (5.00)
Volume 5 Issue 3 (2023) 4 https://doi.org/10.36922/jcau.1055