
Page 66 - JCAU-5-3
P. 66
Journal of Chinese
Architecture and Urbanism Ecosystem service evaluation on ecological restoration
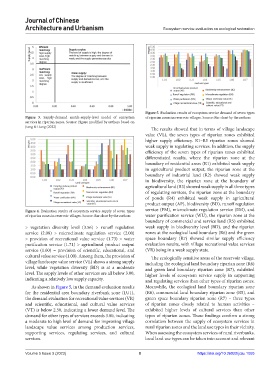
Figure 5. Evaluation results of ecosystem service demand of seven types
Figure 3. Supply-demand match-supply-level model of ecosystem of riparian zones in reservoir villages. Source: Bar chart by the authors
services in riparian zones. Source: Figure modified by authors based on
Jiang & Liang (2022)
The results showed that in terms of village landscape
value (VL), the seven types of riparian zones exhibited
higher supply efficiency. R1–R5 riparian zones showed
weak supply in regulating services. In addition, the supply
efficiency of the seven types of riparian zones exhibited
differentiated results, where the riparian zone at the
boundary of residential areas (R1) exhibited weak supply
in agricultural product output, the riparian zone at the
boundary of industrial land (R2) showed weak supply
in biodiversity, the riparian zone at the boundary of
agricultural land (R3) showed weak supply in all three types
of regulating services, the riparian zone at the boundary
of ponds (R4) exhibited weak supply in agricultural
product output (AP), biodiversity (BD), runoff regulation
Figure 4. Evaluation results of ecosystem service supply of seven types service (FM), microclimate regulation service (EM), and
of riparian zones in reservoir villages. Source: Bar chart by the authors water purification service (WU), the riparian zone at the
boundary of commercial and service land (R5) exhibited
> vegetation diversity level (3.56) > runoff regulation weak supply in biodiversity level (BD), and the riparian
service (2.08) > microclimate regulation service (2.00) zones at the ecological land boundary (R6) and the green
> provision of recreational value service (1.73) > water space boundary (R7) showed similar supply efficiency
purification service (1.71) > agricultural product output evaluation results, with village recreational value services
service (1.00) = provision of scientific, educational, and (VR) being in a weak supply state.
cultural value service (1.00). Among them, the provision of The ecologically sensitive areas of the reservoir village,
village landscape value service (VL) shows a strong supply including the ecological land boundary riparian zone (R6)
level, while vegetation diversity (BD) is at a moderate and green land boundary riparian zone (R7), exhibited
level. The supply levels of other services are all below 3.00, higher levels of ecosystem service supply in supporting
indicating a relatively low supply capacity. and regulating services than other types of riparian zones.
As shown in Figure 5, in the demand evaluation results Meanwhile, the ecological land boundary riparian zone
for the residential area boundary riverbank zone (LU1), (R6), commercial land boundary riparian zone (R5), and
the demand evaluation for recreational value services (VR) green space boundary riparian zone (R7) – three types
and scientific, educational, and cultural value services of riparian zones closely related to human activities –
(VT) is below 2.50, indicating a lower demand level. The exhibited higher levels of cultural services than other
demand for other types of services exceeds 3.00, indicating types of riparian zones. These findings confirm a strong
a moderate to high level of demand for improving village correlation between the supply of ecosystem services in
landscape value services among production services, rural riparian zones and the land use types in their vicinity.
supporting services, regulating services, and cultural When assessing the ecosystem services of rural riverbanks,
services. local land use types can be taken into account and relevant
Volume 5 Issue 3 (2023) 8 https://doi.org/10.36922/jcau.1055