
Page 34 - JCAU-6-3
P. 34
Journal of Chinese
Architecture and Urbanism Multidimensional image of Guilin’s central space
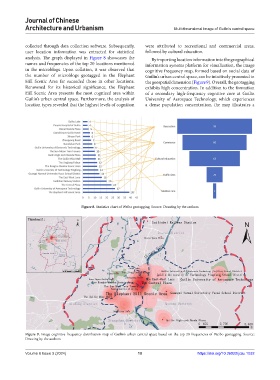
collected through data collection software. Subsequently, were attributed to recreational and commercial areas,
user location information was extracted for statistical followed by cultural education.
analysis. The graph displayed in Figure 8 showcases the By importing location information into the geographical
names and frequencies of the top 20 locations mentioned information systems platform for visualization, the image
in the microblogs. Upon collation, it was observed that cognitive frequency map, formed based on social data of
the number of microblogs geotagged in the Elephant Guilin’s urban central space, can be intuitively presented in
Hill Scenic Area far exceeded those in other locations. the geospatial dimension (Figure 9). Overall, the geotagging
Renowned for its historical significance, the Elephant exhibits high concentration. In addition to the formation
Hill Scenic Area presents the most cognized area within of a secondary high-frequency cognitive core at Guilin
Guilin’s urban central space. Furthermore, the analysis of University of Aerospace Technology, which experiences
location types revealed that the highest levels of cognition a dense population concentration, the map illustrates a
Figure 8. Statistics chart of Weibo geotagging. Source: Drawing by the authors
Figure 9. Image cognitive frequency distribution map of Guilin’s urban central space based on the top 20 frequencies of Weibo geotagging. Source:
Drawing by the authors
Volume 6 Issue 3 (2024) 10 https://doi.org/10.36922/jcau.1032