
Page 93 - JCAU-6-4
P. 93
Journal of Chinese
Architecture and Urbanism Village spatial form and activation
A B
C D
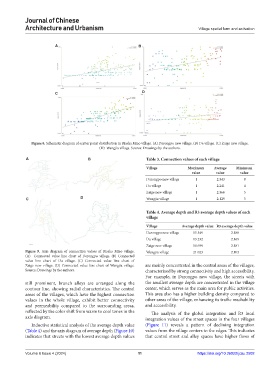
Figure 8. Schematic diagram of scatter point distribution in Biasha Miao village. (A) Darongpo new village. (B) Da village. (C) Zaige new village.
(D) Wangjia village. Source: Drawings by the authors.
A B Table 3. Connection values of each village
Village Maximum Average Minimum
value value value
Darongpo new village 1 2.343 8
Da village 1 2.241 4
Zaige new village 1 2.366 5
C D Wangjia village 1 2.129 5
Table 4. Average depth and R3 average depth values of each
village
Village Average depth value R3 average depth value
Darongpo new village 15.549 2.188
Da village 13.232 2.169
Zaige new village 10.699 2.181
Figure 9. Axis diagram of connection values of Biasha Miao village. Wangjia village 21.023 2.103
(A) Connected value line chart of Derongpo village. (B) Connected
value line chart of Da village. (C) Connected value line chart of
Zaige new village. (D) Connected value line chart of Wangjia village. are mainly concentrated in the central areas of the villages,
Source: Drawings by the authors. characterized by strong connectivity and high accessibility.
For example, in Darongpo new village, the streets with
still prominent, branch alleys are arranged along the the smallest average depth are concentrated in the village
contour line, showing radial characteristics. The central center, which serves as the main area for public activities.
areas of the villages, which have the highest connection This area also has a higher building density compared to
values in the whole village, exhibit better connectivity other areas of the village, enhancing its traffic reachability
and permeability compared to the surrounding areas, and accessibility.
reflected by the color shift from warm to cool tones in the The analysis of the global integration and R3 local
axis diagram. integration values of the street spaces in the four villages
Inductive statistical analysis of the average depth value (Figure 11) reveals a pattern of declining integration
(Table 4) and the axis diagram of average depth (Figure 10) values from the village centers to the edges. This indicates
indicates that streets with the lowest average depth values that central street and alley spaces have higher flows of
Volume 6 Issue 4 (2024) 11 https://doi.org/10.36922/jcau.2502